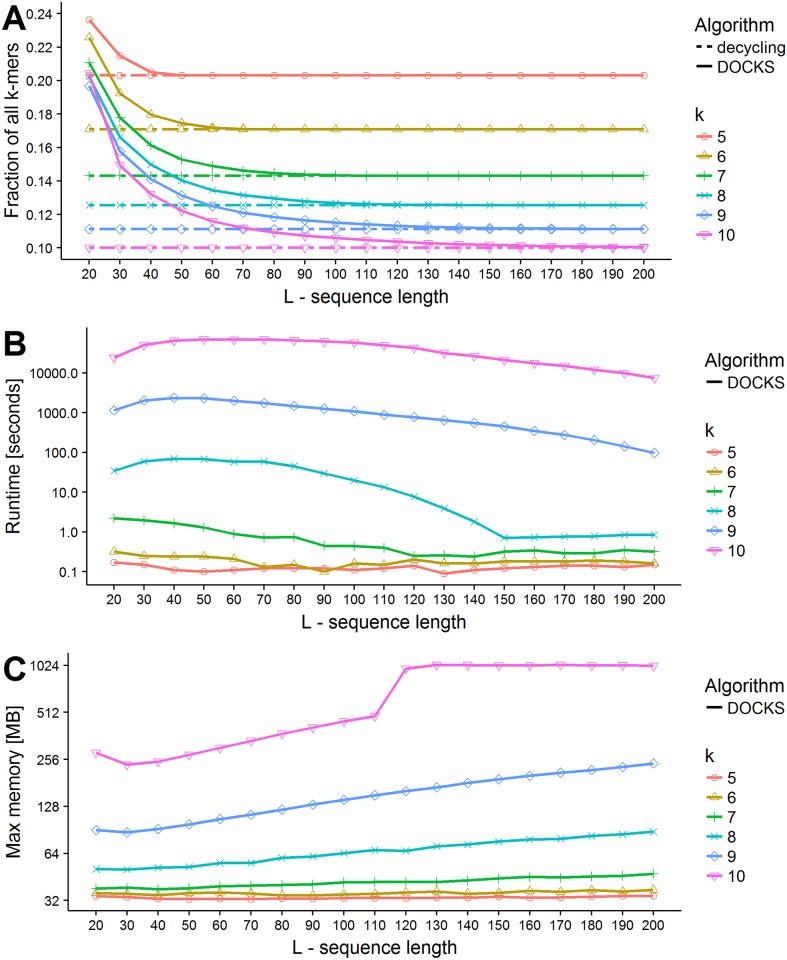
Fig 1. Performance of DOCKS.
For different combinations of k and L we ran DOCKS over the DNA alphabet. (A) Set sizes. The results are shown as a fraction of the total number of k-mers |Σ|k. The broken lines show the decycling set size for each k. (B) Running time in seconds. Note that y-axis is in log scale. (C) Maximum memory usage in megabytes. Note that y-axis is in log scale.

