
Fig. 1.
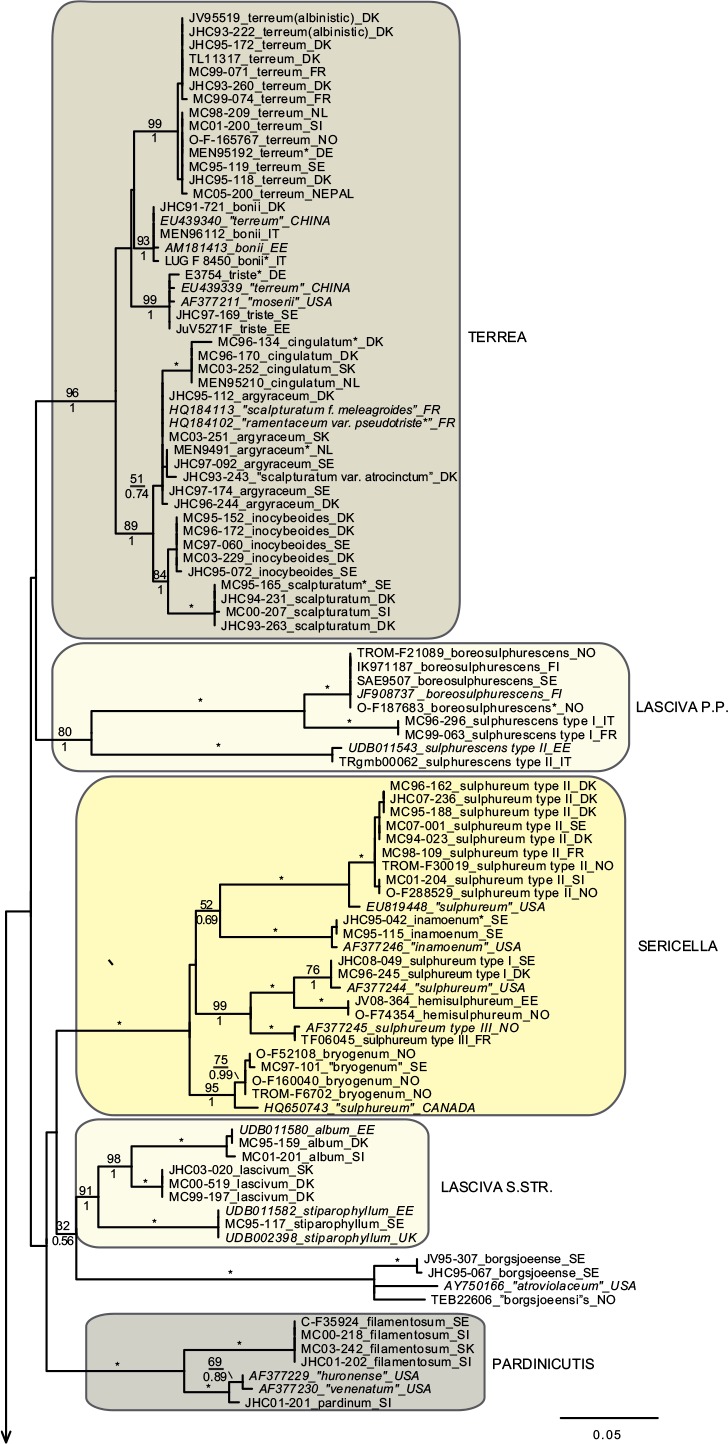
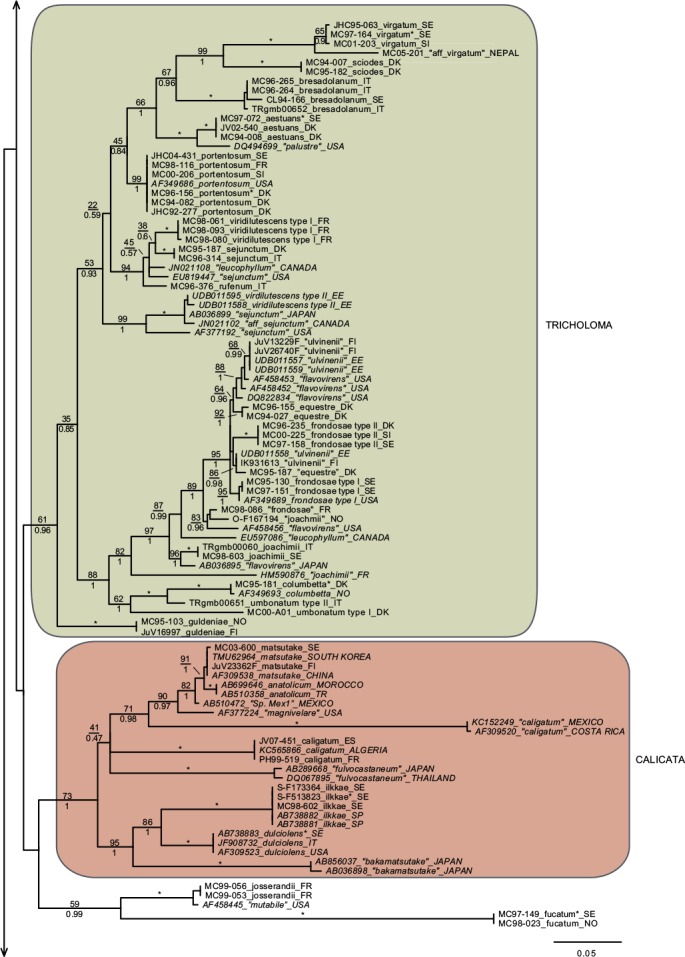
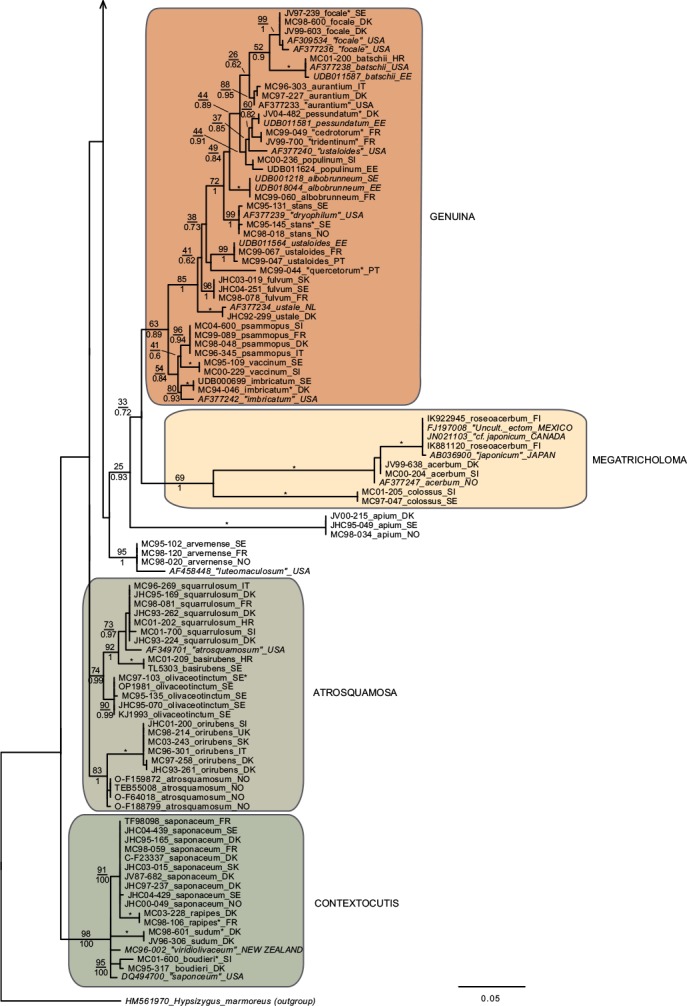
Phylogeny inferred from ITS regions for the full dataset, with branch lengths based on the Maximum Likelihood analysis. No notable differences in branching patterns were observed between the Bayesian and the Maximum Likelihood analysis. Maximum Likelihood bootstrap values are indicated above branches, while Bayesian posterior probabilities are indicated below branches. * Denotes 100 % support in both analyses. New sequences obtained for this study are indicated in regular letters, while sequences obtained from GenBank or Unite are given in italics. Species names without quotes represent our interpretation of relevant taxa as discussed in this paper. Names in quotes are not interpreted by us, but are given as in the original source, or by the collector. Hypothesized sections are indicated by background shadings with names in capital letters.