
Figure 4.
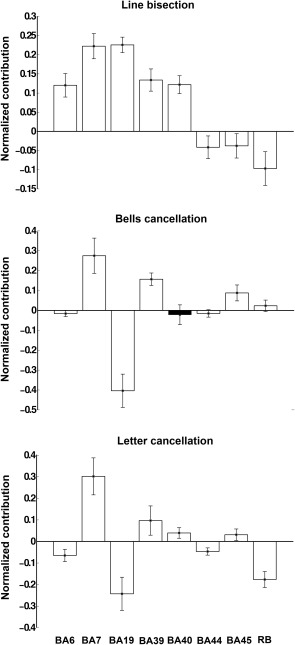
Regional MSA functional contributions to attentional function. Normalized mean MSA contribution values (± standard deviation, SD) for line bisection, bells cancellation, and letter cancellation, respectively, computed using the original‐graded dataset based on the machine‐learning prediction of performance scores corresponding to the complete set of 256 configurations. Positive values indicate positive contributions (hence injury of the respective regions leads to decreased performance) whereas negative values indicate negative contributions (injury of the respective regions results in increased performance). All contributions, except that of BA40/IFG in the bells cancellation test (shown in black), were statistically significant, after Bonferroni correction (adjusted p‐value <0.0063).