Figure 3.

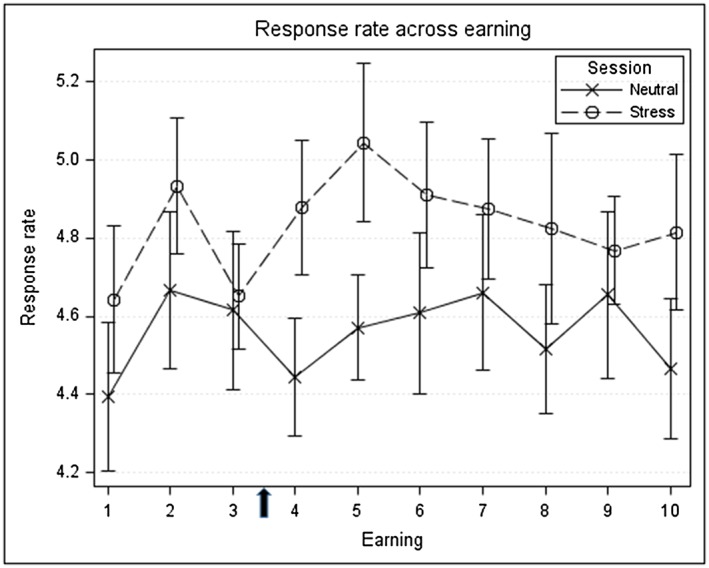
Response rate (clicks/second) across reinforcement opportunities as a function of session type. Rates during the neutral session are shown in blue, and rates during the stress session are shown in red. Points show mean and standard error

Response rate (clicks/second) across reinforcement opportunities as a function of session type. Rates during the neutral session are shown in blue, and rates during the stress session are shown in red. Points show mean and standard error