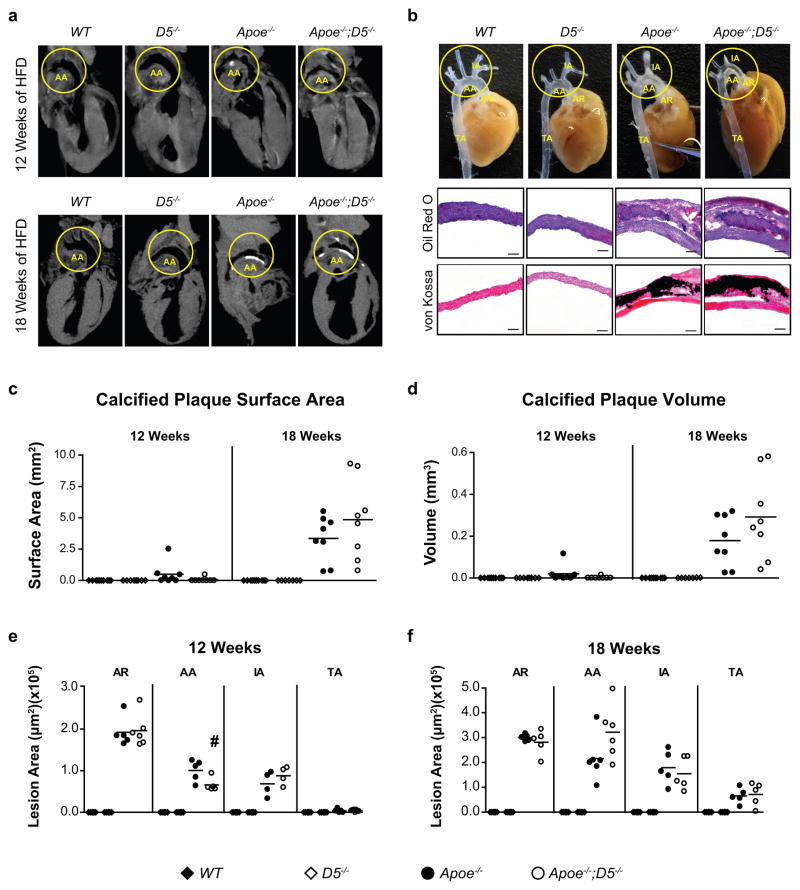
Figure 6. Deletion of the RANKL D5 enhancer delays the progression of atherosclerotic plaque formation and plaque calcification in hypercholesterolemic Apoe-null mice.
(a) Representative μCT images of WT, D5−/−, Apoe−/− and Apoe−/−;D5−/− mice (n = 7 – 10 per group) fed a high-fat diet (HFD) for either 12 or 18 weeks. (b) Representative photographs of aortae showing fatty streaks within aortic root (AR), aortic arch (AA), innominate artery (IA) and thoracic aorta (TA) of WT, D5−/−, Apoe−/− and Apoe−/−;D5−/− mice after 12 weeks of HFD feeding. Oil red O and von Kossa staining confirmed the presence of atherosclerotic lesions and plaque calcification, respectively in the aortic arch of WT, D5−/−, Apoe−/− and Apoe−/−;D5−/− mice after 18 weeks of HFD feeding. Scale bar, 50 μm. (B). (c, d), Total calcified plaque surface area (c) and total calcified plaque volume (d) quantified by μCT analysis in aortae of WT, D5−/−, Apoe−/− and Apoe−/−;D5−/− mice (n = 5 – 8 per group) fed the HFD for either 12 or 18 weeks. (e, f), Mean atherosclerotic lesion areas in AR, AA, IA and TA of WT, D5−/−, Apoe−/− and Apoe−/−;D5−/− mice (n = 5 – 8 per group) fed the HFD for either 12 or 18 weeks. On scatter plot each point indicates a single mouse. Values represent mean ± s.e.m. *P < 0.05 versus WT, #P < 0.05 versus Apoe−/−, calculated by one-way ANOVA.

