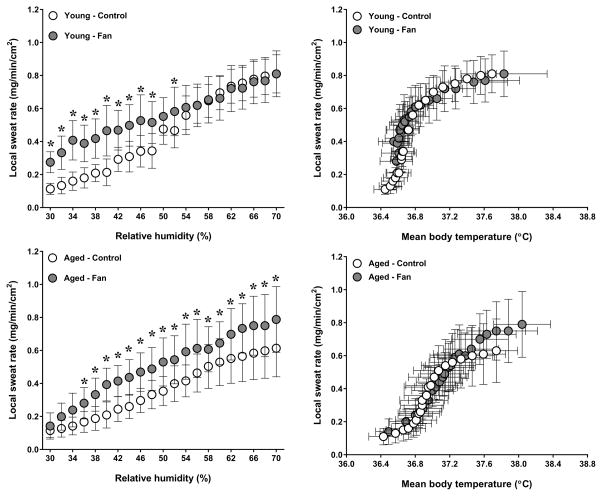
Figure 3.
Local forearm sweat rate plotted as a function of relative humidity (left panels) and mean body temperature (right panels) in young (top panels) and aged (bottom panels) adults exposed to extreme heat and humidity without (control) and with (fan) fan use. Values are mean ± 95% confidence intervals. *, P<0.05 between conditions.

