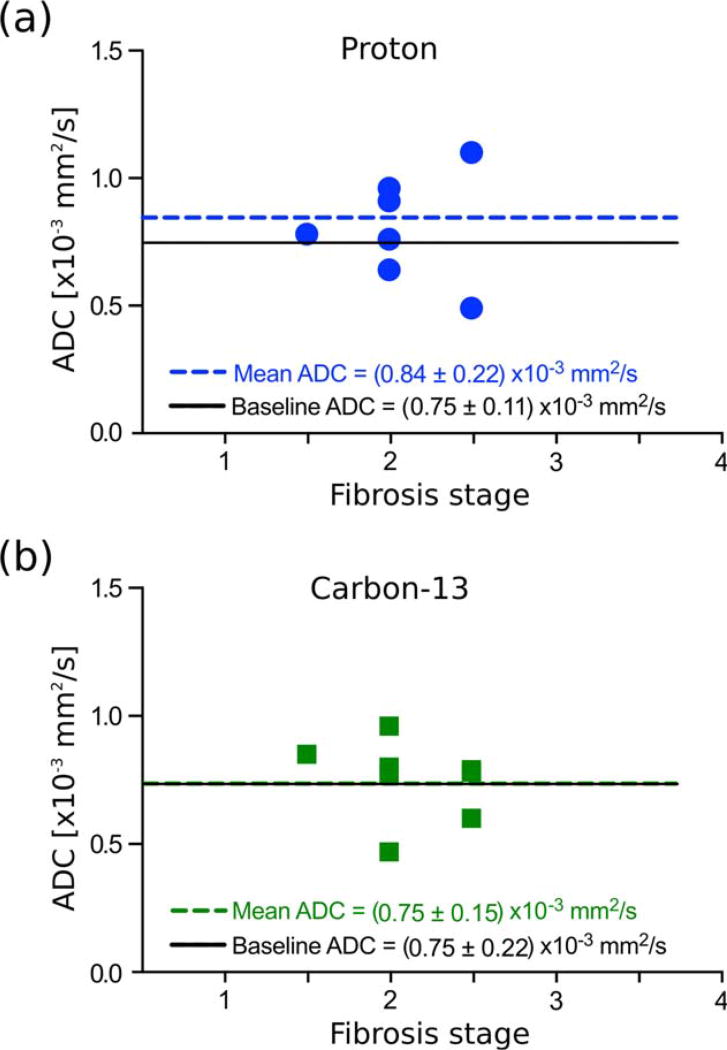
FIGURE 8.
Post-CCl4 treatment ADCs of the right lobe of the liver for different stages of fibrosis (a) for water (proton) and (b) [13C, 15N]urea (carbon). These data are also shown in Fig. 7. The mean ADC across all fibrosis stages is shown with a dashed line, and the baseline ADC is shown with a solid black line.

