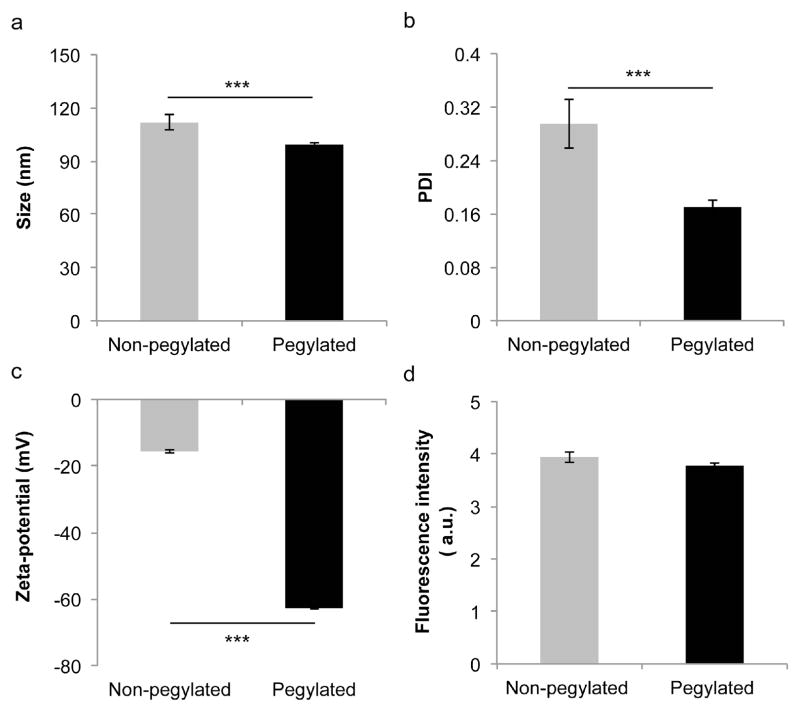
Figure 2.
Characterization of non-pegylated and pegylated liposomes. a) Size. b) PDI. c) Zeta potential. d) Fluorescence intensity. Results are expressed as the mean ± s.d. of five measurements with ten runs each (a, b, c) or triplicates (d). The student’s t-test was used to calculate statistical significance. ***, P < 0.001. A.u., arbitrary unit.

