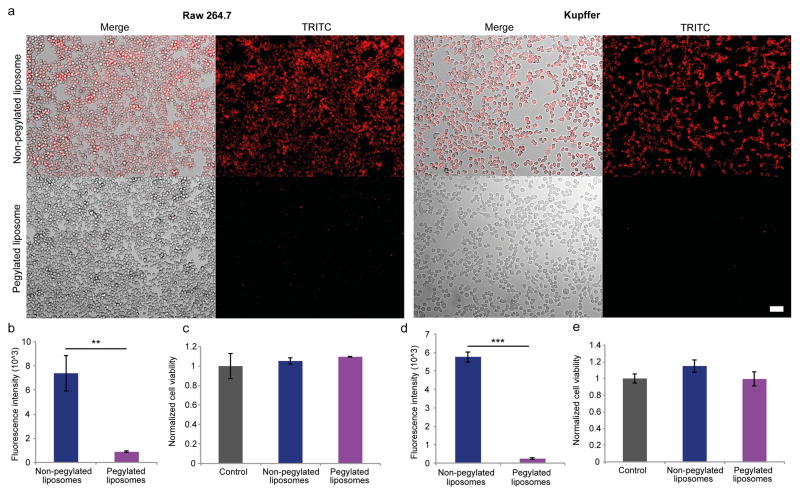
Figure 4.
Liposomal uptake and cell viability of macrophages. Fluorescently-labled non-pegyalated and pegylated liposomes were incubated for 3 h with Raw 264.7 cells and Kupffer cells. a) Representative images of liposome uptake. Scale bar, 50 μm. Quantitative measurements of fluorescence intensity of Raw 264.7 (b) and Kupffer (d) cells exposed to liposomes. Viability of Raw 264.7 (c) and Kupffer (e) cells exposed to liposomes. Results were normalized to the control cells. Data is presented as mean ± s.d. of triplicates. The Student’s t-test was used to calculate statistical significance. **, P < 0.01; ***, P < 0.001.

