
Figure 2. STRAP maintains stem-like phenotype of CRC cells in vitro and in vivo.
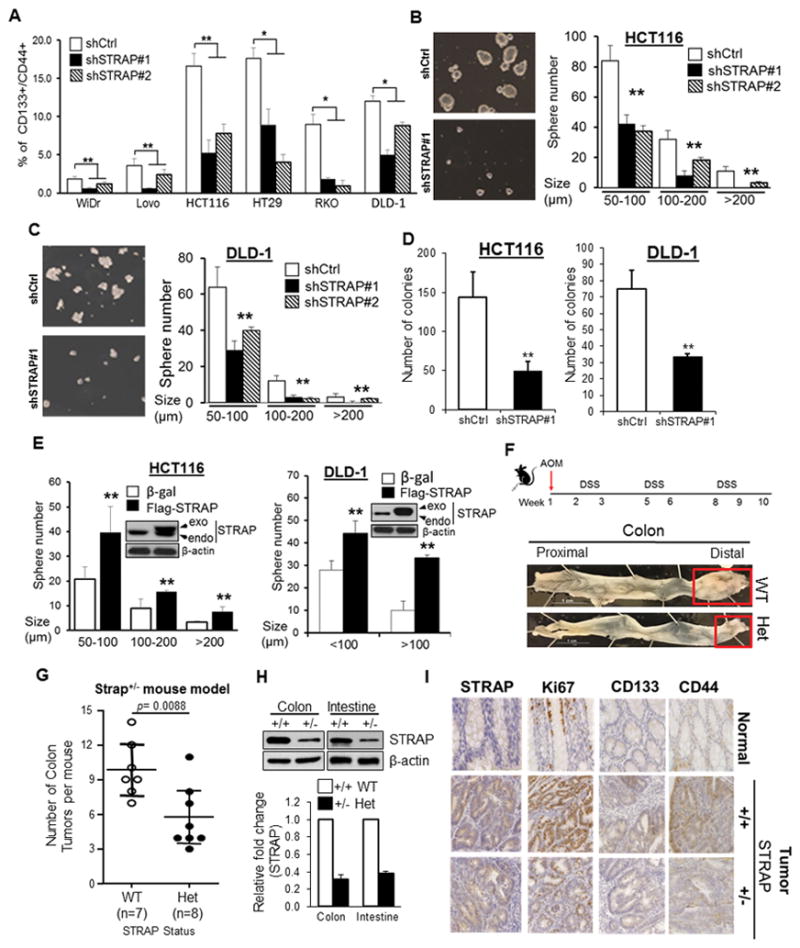
A. The fraction of CD133+/CD44+ cells in stable STRAP knockdown (KD) CRC clones (WiDR, LoVo, HCT116, HT-29, RKO and DLD-1) was analyzed by flow cytometry and plotted as % positive cells. Significance levels were determined by Student’s t test. n=3, *P<0.05, **P< 0.01, when compared with the control. B and C. Sphere-shaped cells were generated from HCT116 shSTRAP#1 and corresponding shCtrl cells after three days cultured in sphere-conditioned media (left panel). The number and size of spheres derived from STRAP KD cells were compared to those of control cells (right panel). Similar experiment was performed in STRAP KD DLD-1 cells. n=3, **P< 0.01 vs shCtrl. D. Colony formation assays were performed with HCT116 and DLD-1 cells. The number of colonies larger than 200 μm was counted, **P< 0.01, compared to control. E. The number and size of spheres derived from shSTRAP#1 HCT116 and DLD-1 clones after infection with Flag-tagged STRAP adenovirus were compared with those of β-gal adenovirus-infected cells. Endogenous and exogenous protein levels of STRAP were detected by western blot analyses, **P< 0.01 vs β-gal control. F. Schematic diagram of AOM and DSS administration to induce colon cancer development in mice (both wild type and Strap heterozygous mice) is presented. AOM (10 mg/kg) was injected on day 0. At the beginning of the second week, 2.5% DSS solution was administered to mice in their drinking water. Seven days of DSS treatment was followed by two weeks of water. Two more cycles of DSS and water were administered prior to sacrifice by the end of the tenth week (upper panel). As expected, the majority of tumors are located in the distal region (as indicated, bottom panel). G. Representative distribution of the number of tumors per mouse treated with AOM/DSS. Significance levels are determined by independent Student’s t-test. H. Expression of STRAP in colon and intestine tissues from indicated mice was examined by western blotting. β-actin was used as loading control (upper). Relative fold change of STRAP was determined by densitometry using ImageJ software (bottom). I. Immunohistochemical staining for the proliferation marker Ki67, CD133 and CD44 as well as for STRAP was analyzed in colon using tissue slides from AOM/DSS mouse model. Pictures are representative of both normal tissue and tumor segments from Strap+/+ and Strap+/− mice. Magnification, X40.