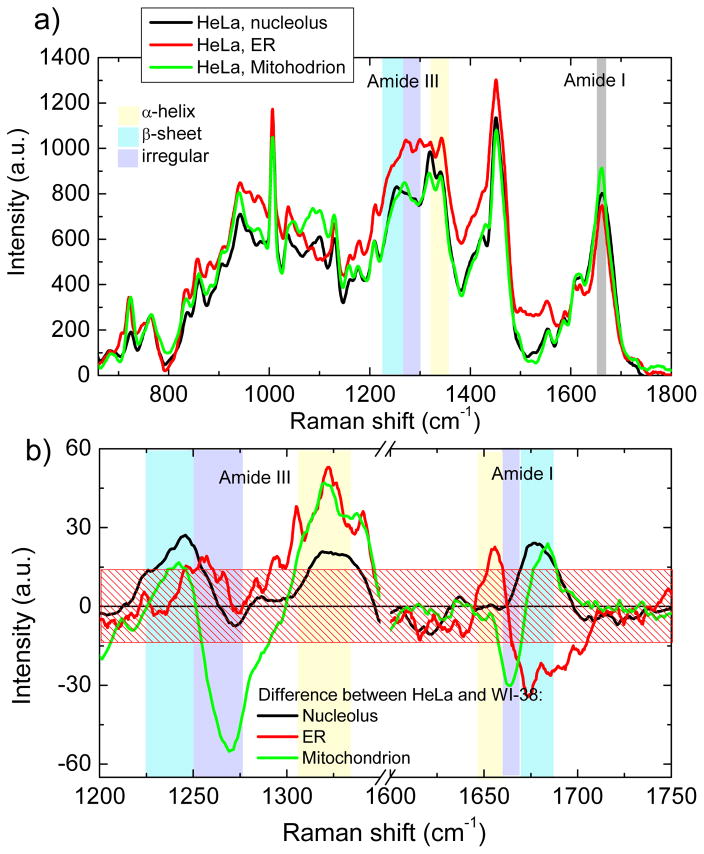
Fig. 2.
(a) Proteins components of nucleolus (black), ER (red) and mitochondrion (green) in HeLa cells. The wavenumber regions, assigned to different protein conformations are shown as a colored bands. (b) Differential spectra between proteins components of HeLa and WI-38 cells for nucleolus (black), ER (red) and mitochondrion (green) in the Amide I and Amide III wavenumber regions. Standard error, averaged over all spectral range, is shown as a patterned box.

