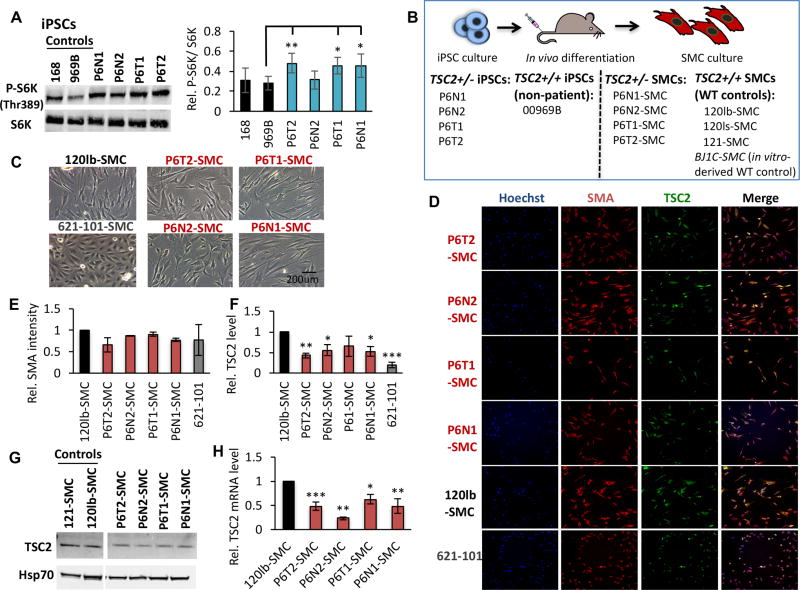
Figure 2.
Establishment of TSC/LAM patient-derived SMC lines. (A) Representative western blot analysis and densitometry quantification, expressed as relative to control cell line 969B, of total and phosphorylated (P-S6K, Thr389) S6K in control and P6 iPSC lines. (B) Four P6 iPSC lines (as indicated), and one non-patient WT control iPSC line (969B, as indicated), were injected intramuscularly for in vivo differentiation in teratomas and explants were cultured under SMC growth conditions. The four SMC patient-derived lines and three SMC WT control lines that were established using this approach are indicated. Note we also use a fourth WT control SMC line in this study, BJIC-SMC, which was generated by in vitro differentiation of non-patient iPSCs. Representative phase contrast (C) and high content imaging (HCI) immunofluorescence (smooth muscle actin [SMA], TSC2; D) images of P6-derived, 120lb-SMC control and 621-101 cells. Quantification of HCI images for mean intensity of SMA (E) and TSC2 (F) proteins, expressed as relative to 120lb-SMC controls, as well as western blot for TSC2 (G), in cultured cell lines. (H) TSC2 mRNA expression relative to 120lb-SMCs. Statistics are relative to 969B (A), and 120lb-SMC (E, F, H) controls. P values of <0.05 (*), <0.01 (**) and <0.001 (***) are indicated where statistical differences were observed. A minimum of three biological replicates were performed for each experiment.

