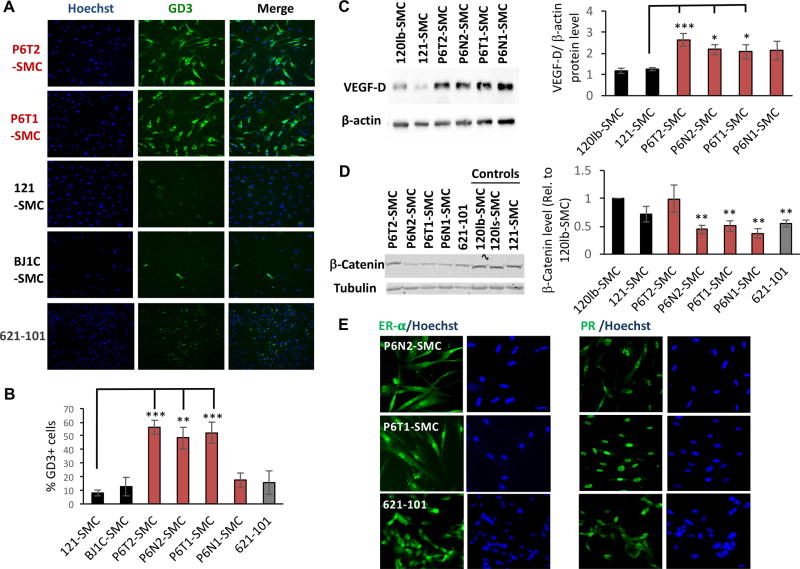
Figure 4.
Patient-derived SMCs exhibit known LAM cell biomarkers. (A) HCI for ganglioside D3 (GD3) and Hoechst nuclear stain in control (121-SMC, BJ1C-SMC), P6-SMC, and 621-101 cell lines, with representative quantification (B). (C) Representative western blots and densitometry quantification (expressed as VEGF-D levels normalized to β-actin expression) for VEGF-D in P6-SMC and control (120lb-SMC, 121-SMC) lines. (D) Representative western blots and densitometry quantification (normalized to tubulin and expressed as relative to 120lb-SMC control) for β-Catenin in P6-SMC and control (120lb-SMC, 120ls-SMC, 121-SMC) lines. (E) Representative immunofluorescence images for estrogen receptor alpha (ER-α) and progesterone receptor (PR), and the corresponding Hoechst images, in P6-SMC lines and 621-101 cells. Statistics are relative to 121-SMC (B, C), and 120lb-SMC (D) controls. P values of <0.05 (*), <0.01 (**) and <0.001 (***) are indicated. A minimum of four and up to seven biological replicates were performed for each experiment.

