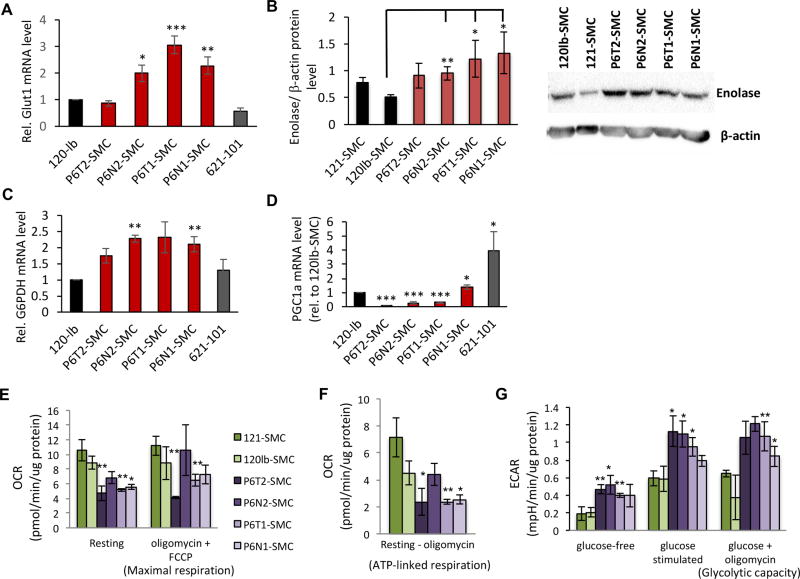
Figure 5.
TSC2+/− SMCs exhibit metabolic reprogramming to a glycolytic state. (A) qRT-PCR analysis of GLUT1 expression in SMC lines and 621-101 cells, expressed as relative to 120lb-SMC control. (B) Representative western blot (lower panel) and densitometry-based quantification (upper panel) of enolase expression (plotted are enolase levels normalized to β-actin levels) in SMC lines. qRT-PCR analysis of G6PDH (C) and PGC1a (D) expression in SMC lines (expressed as relative to 120lb control cells). Statistics for A–D are relative to the 120lb-SMC control line. Oxygen consumption rate (OCR) measurements under resting and maximal respiratory conditions (E), and the difference between OCR levels at resting state and following exposure to oligomycin to indicate ATP turnover (F). Extracellular acidification rate (ECAR) under glucose-free and maximal (+glucose, +oligomycin) conditions (G). For E–G, control (green bars) and P6-derived (purple bars) SMC lines are normalized to total protein as indicated. Statistics are relative to the average of the two control lines. P values of <0.05 (*), <0.01 (**) and <0.001 (***) are indicated. t-tests were performed for panels B and G. A minimum of three biological replicates were performed for each experiment.

