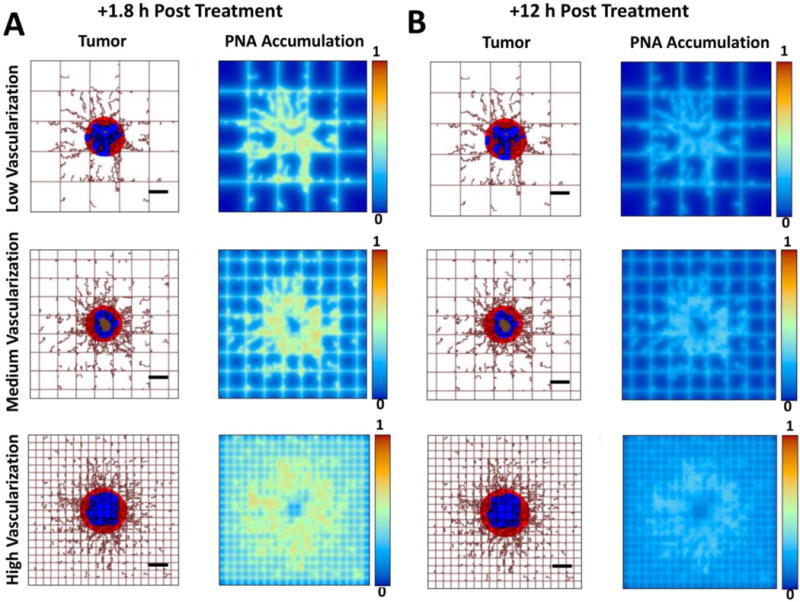
Figure 11.

Computational simulations of PNA distribution in metastatic tumors at 1.8 h (A) and 12 h (B) after systemic injection of the nanoparticles for three varying degrees of vascularization (low, medium, high) in the surroundings of the tumor. Viable tumor tissue (red) is shown enclosing hypoxic (blue) and necrotic (brown) regions. Capillary network is represented by rectangular grid, with irregular sprouts simulating blood vessel growth via angiogenesis, driven by release of tumor angiogenic factors from the hypoxic tissue within the tumor. PNA concentration is normalized to the maximum value in the vessels. (Bar = 250 μm)
