
Figure 6.
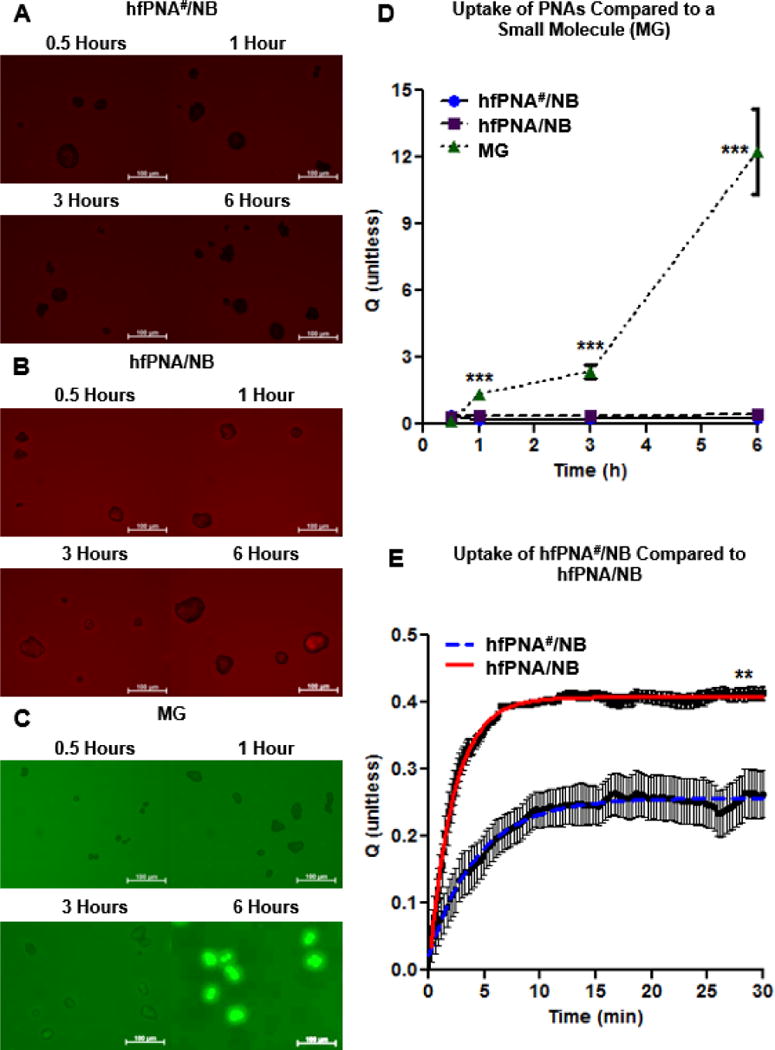
Cellular uptake imaging of hfPNA#/NB (A), hfPNA/NB (B) and MG (C). Uptake of PNAs and MG were compared up to 6 h (D). Uptake of hfPNA#/NB and hfPNA/NB was compared for 0.5 h (E).
Official websites use .gov
A
.gov website belongs to an official
government organization in the United States.
Secure .gov websites use HTTPS
A lock (
) or https:// means you've safely
connected to the .gov website. Share sensitive
information only on official, secure websites.
Cellular uptake imaging of hfPNA#/NB (A), hfPNA/NB (B) and MG (C). Uptake of PNAs and MG were compared up to 6 h (D). Uptake of hfPNA#/NB and hfPNA/NB was compared for 0.5 h (E).