Figure 3.
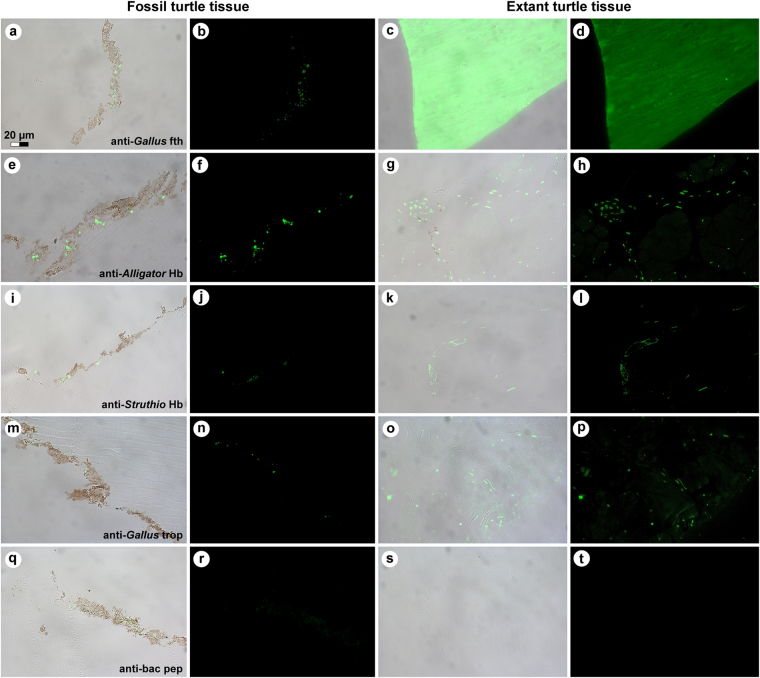
Immunoreactivity of fossil and extant turtle tissues. Immunohistochemical staining results for (a,b,e,f,i,j,m,n,q,r; columns 1 and 2) MHM-K2 and Chelonia mydas (c,d; columns 3 and 4) carapace scute and (g,h,k,l,o,p,s,t; columns 3 and 4) muscle tissue to antibodies raised against (a–d; row 1) Gallus gallus domesticus feathers (anti-Gallus fth), (e–h; row 2) Alligator mississippiensis haemoglobin (anti-Alligator Hb), (i–l; row 3) Struthio camelus haemoglobin (anti-Struthio Hb), (m–p; row 4) G. g. domesticus tropomyosin (anti-Gallus trop), and (q–t; row 5) bacterial peptidoglycan (anti-bac pep). a,c,e,g,i,k,m,o,q,s are overlay images, superimposing fluorescent signal on transmitted light image of sectioned tissue to reveal the localisation of antibody-antigen complexes to tissue. b,d,f,h,j,l,n,p,r,t are imaged using a FITC filter. Antibody-antigen complexes are indicated by green fluorescent signal.

