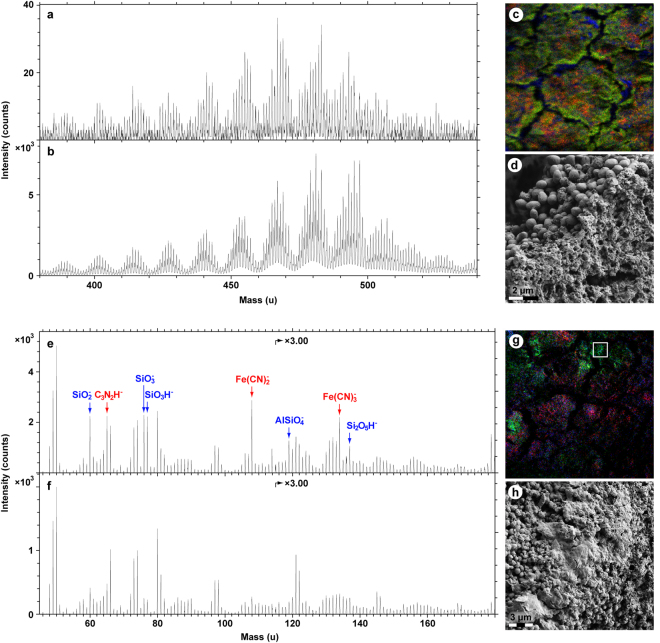
Figure 5.
Molecular characterisation of MHM-K2 tissues by ToF-SIMS analysis. (a) Positive ion spectrum from a region with strong signal from heme-related ions. (b) Positive ion spectrum of a heme (hemin) standard. (c) Negative ion image showing the signal intensity distribution of ions representing heme (red; 65 + 108 + 134 u), eumelanin (green; 66 + 73 + 74 + 97 + 98 + 121 + 122 u) and silica (blue; 60 + 76 + 77 u). Field of view: 200 × 200 µm2. (d) FEG-SEM micrograph showing a fracture edge. Note abundant microbodies in the crack wall and vesicular texture of the surface. (e) Negative ion spectrum from a region with mixed signal from eumelanin- and heme-related ions. (f) Negative ion spectrum from a region dominated by signal from eumelanin-related ions. (g) Positive ion image showing the signal intensity distribution of ions representing heme (red; 436–488 u), aromatics (blue; 91 + 115 u) and proteinaceous materials (green; 30 + 44 + 70 u). Field of view: 328 × 328 µm2. (h) FEG-SEM micrograph of the demarcated area in g depicting sheet-like matter with high signal from amino acid-related peaks.

