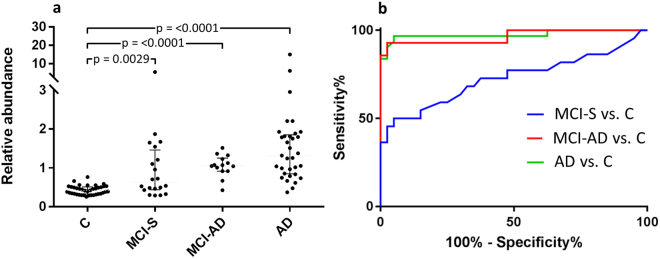
Figure 2.
Top biomarker candidate cluster #7367. (a) Scatter plot of the relative abundance over the different patient groups. The cluster was increased by 222% in AD versus C, by 153% in MCI-AD versus C and by 35% in MCI-S versus C. The p-values were obtained by Mann-Whitney test. (b) ROC curve analysis. The cluster had an AUC of 0.96 for separating AD versus C, an AUC of 0.96 for MCI-AD versus C and an AUC of 0.72 for MCI-S versus C.

