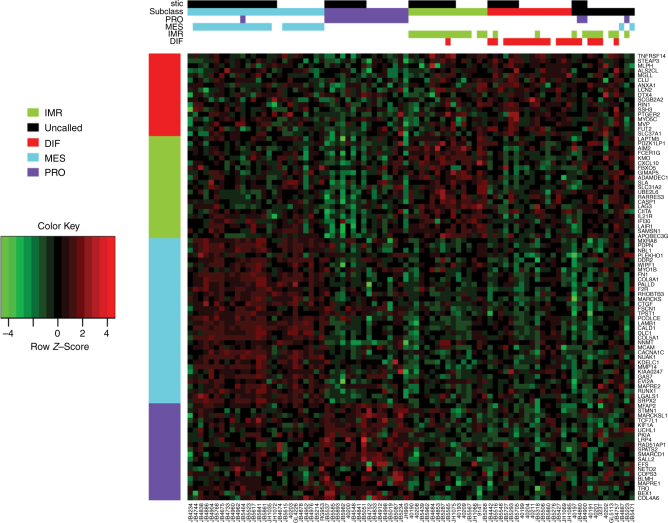
Fig. 5.
TCGA features of study samples using a gene expression subtype signature. Gene expression using a 100 gene subtype signature and ordered by assigned subtype. Group membership is assigned by color in the top rows for subtypes with > 0.2 correlation. For samples with more than one robust correlation, the highest correlation was assigned if it was at least 1.5 × higher than the next highest subtype correlation. Samples to the far right were not assigned to any particular subtype. STIC status is shown in the top row

