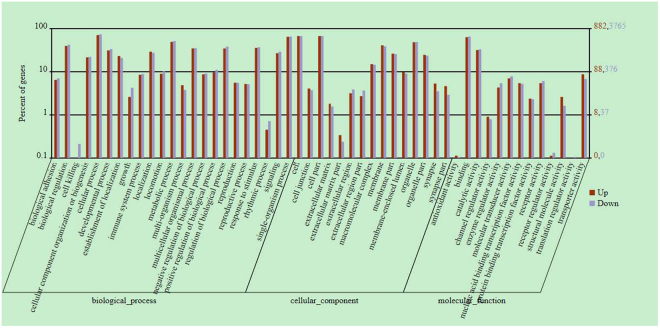
Figure 6.
Annotation analysis of methylated genes in Tg(fabp10:nras 61K) transgenic zebrafish (12 mpf). Annotation of methylated genes with WEGO. Of all the genes that have GO annotations, 8,599 methylated genes show significant enrichment difference (P < 0.05, χ2 test) compared with total analyzed genes. Annotations are grouped by molecular function or biological process based on the gene ontology database (http://www.geneontology.org/). Gene numbers and percentages are listed for each category.

