
Figure 2.
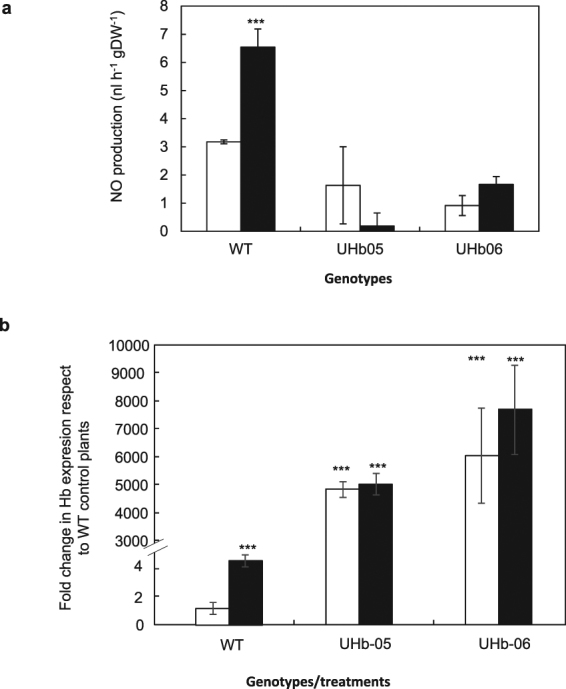
In vivo NO generation and hemoglobin gene expression. (a) In vivo NO measurement in barley UHb-05 and UHb-06 lines and WT Golden Promise intact plants. (b) Expression of HvHb1 gene. White bar = watered controls; Black bars = plants exposed to drought treatment. Data are mean of four replicates ± standard error. *, **, *** indicate significant differences at P < 0.05, 0.01 and 0.001, respectively with respect to WT control plants.