Figure 3.
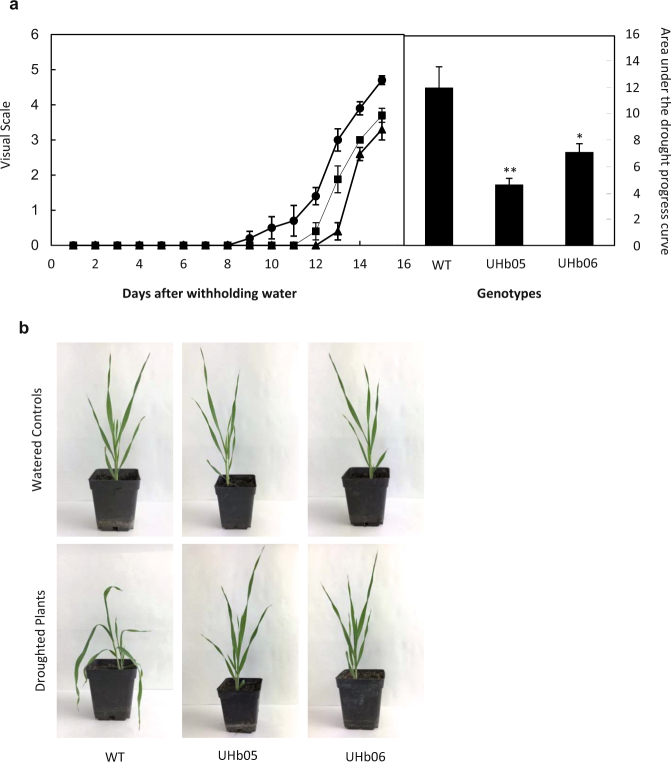
Drought stress symptoms in UHb and wild type (WT) Golden Promise plants. (a) Drought symptoms were evaluated after withholding water according to a visual scale (Sánchez-Martín et al.33) in UHb-05 (triangles), UHb-06 (squares) and WT (circles) plants. Bars in the right panel represent the area under the drought progress curve to assess quantitative stress tolerance, (for details see57). Data are mean of five replicates ± standard error. *, ** indicate significant differences at P < 0.05 and 0.01, respectively between WT and UHb plants. (b) Pictures of WT and UHb plants at 20–25% of sRWC showing more drought symptoms in WT plants.

