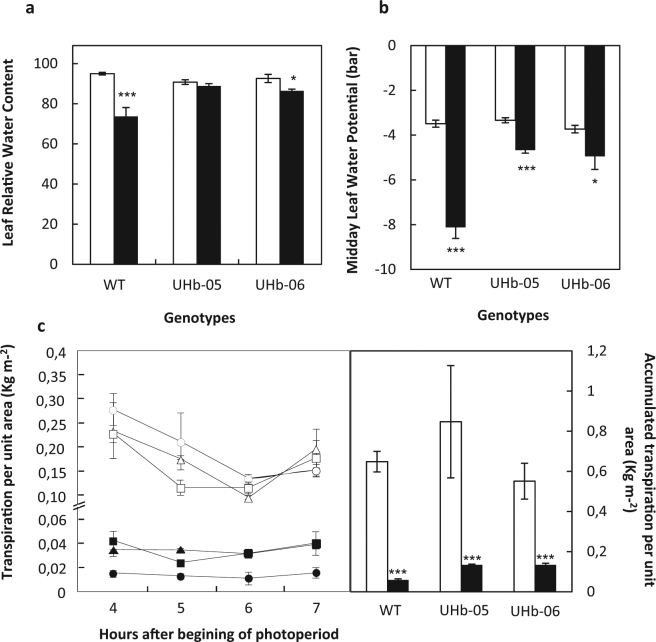
Figure 4.
Water related parameters in UHb and wild type (WT) Golden Promise plants. (a) Leaf relative water content. (b) Midday water potential, and (c) Transpiration. Transpiration rate per unit area was measured at different sampling times (left panel) and as accumulated transpiration per unit area (right panel) representing the sum of all transpired water over the assessed period. All parameters were evaluated at 20–25% soil relative water content in UHb-05 (triangles), UHb-06 (squares), and WT (circles) plants. White bars/symbols = control, well-watered plants; Black bars/symbols = plants exposed to water stress. Data are mean of five replicates ± standard error. *, *** indicate significant differences between droughted and well-watered plants at P < 0.05, and 0.001 respectively.

