Fig. 2.
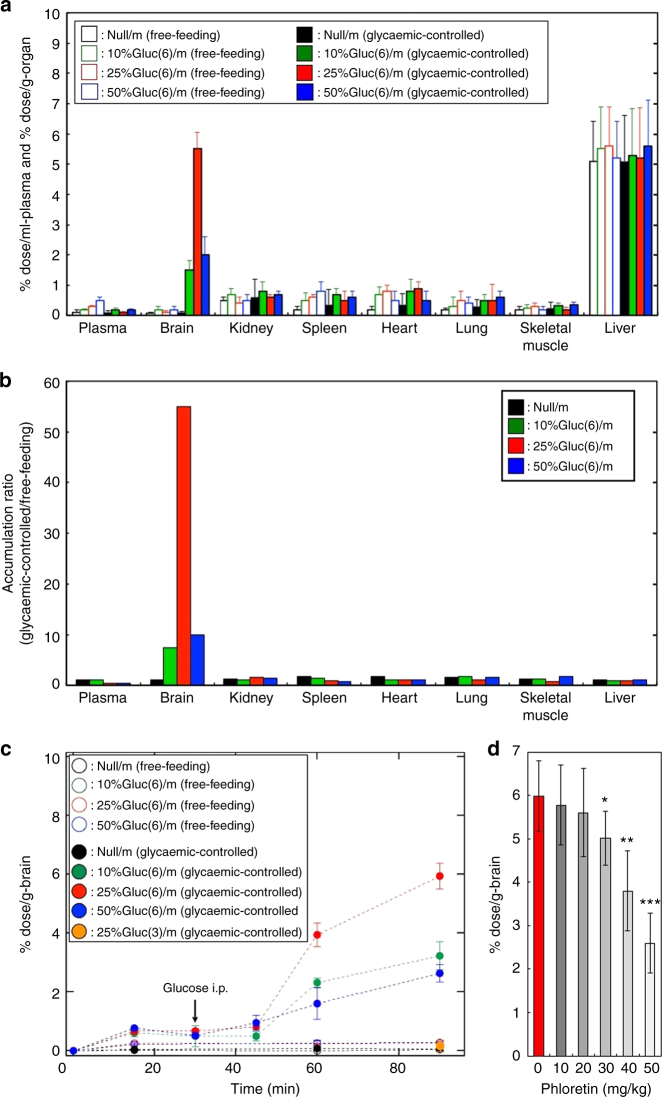
Pharmacokinetic profiles of the polymeric micelles. a Biodistribution of micelles (Null/m and Gluc(6)/m) in mice under different feeding conditions at 48 h after the injection. Open and closed bars show free-feeding and glycaemic-controlled groups, respectively. Black, green, red and blue coloured bars indicate Null/m, 10%Gluc(6)/m, 25%Gluc(6)/m and 50%Gluc(6)/m, respectively. b Accumulation ratio in mice (glycaemic-controlled/free-feeding) of each micelle at 48 h calculated from the values shown in a. c Time course of micelle accumulation (Null/m, Gluc(6)/m and Gluc(3)/m) in the mouse brain under different feeding conditions. The arrow in c indicates when 20 wt% glucose was intraperitoneally injected. Open and closed circles denote the free-feeding and glycaemic-controlled groups, respectively. Black, green, red and blue coloured circles indicate Null/m, 10%Gluc(6)/m, 25%Gluc(6)/m and 50%Gluc(6)/m, respectively. An orange coloured circle shows 25%Gluc(3)/m (glycaemic-controlled). d In vivo inhibition study of the brain accumulation of the 25%Gluc(6)/m by phloretin. Red and grey bars show experiments conducted without and with phloretin, respectively. Experiments were performed using BALB/c mice (female, 6-week-old, n = 5). The data are expressed as the mean ± SEM for a, c, d and as the mean for b. *P < 0.05

