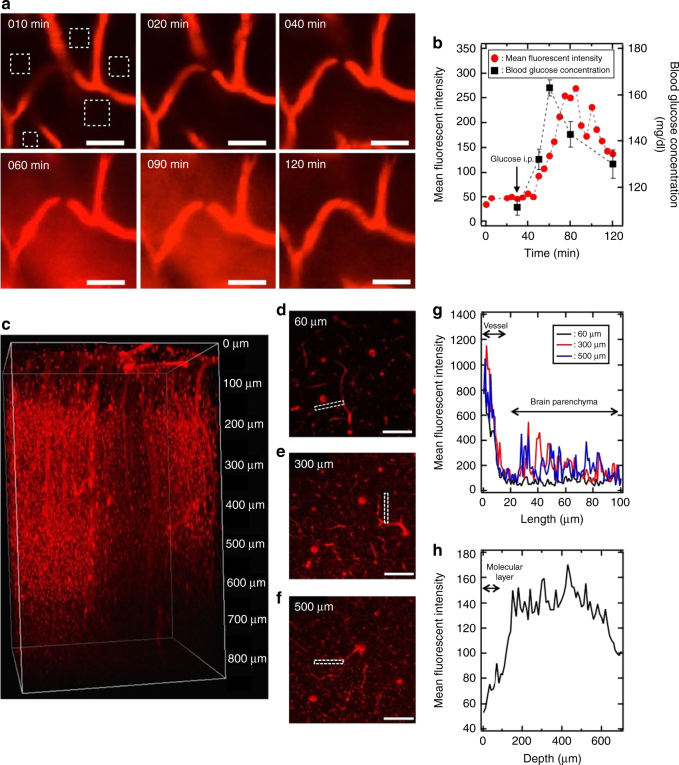
Fig. 3.
Real-time observation of the 25%Gluc(6)/m crossing the BBB. a Sequential images of mouse cerebrum observed using IVRT-CLSM. The 25%Gluc(6)/m (red) were intravenously injected to a mouse after a 24-h fast, followed by an intraperitoneal injection of 20 wt% glucose 30 min later. The scale bars indicate 50 μm. b Time course of blood glucose concentration (black squares) and the mean fluorescent intensities of the 25%Gluc(6)/m (red circles) in the region of interest (ROI) of the brain parenchyma indicated as white rectangles in a. The arrow indicates the time of intraperitoneal injection of the 20 wt% glucose. Blood glucose concentrations were expressed as the mean ± SEM. c Images of Gluc(6)/m (red) in the mouse cerebrum observed using intravital multiphoton microscopy 48 h after administration. Cross-sections at depths of 60 μm (d), 300 μm (e) and 500 μm (f) are also shown. The scale bars indicate 100 μm. g Distribution profiles of Gluc(6)/m from blood vessels to the brain parenchyma in the selected region (indicated by a white rectangle in d, e, f) at depths of 60 μm (black line), 300 μm (red line) and 500 μm (blue line). h Depth profiles of the mean fluorescent intensities from 0 to 700 μm in the brain parenchymal region

