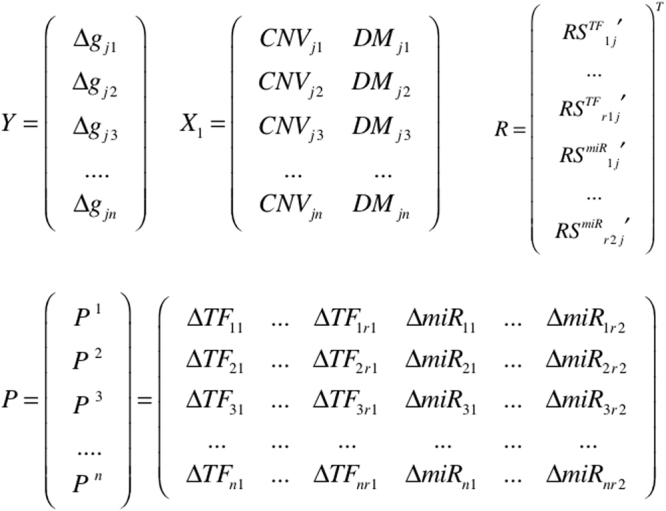
Figure 9.

Four matrices constructed for each gene j and each condition, i.e., a specific cancer stage. Y represents the vector of expression changes of gene j in the corresponding cancer patients under this condition; X 1 represents the matrix of background adjustment factors (CNV and DNA methylation); R represents a RS vector that contains the regulatory scores of all r 1 TF- and r 2 miRNA- regulators of gene j; P is the matrix that includes all the expression changes of each regulator in each patient under the corresponding condition.
