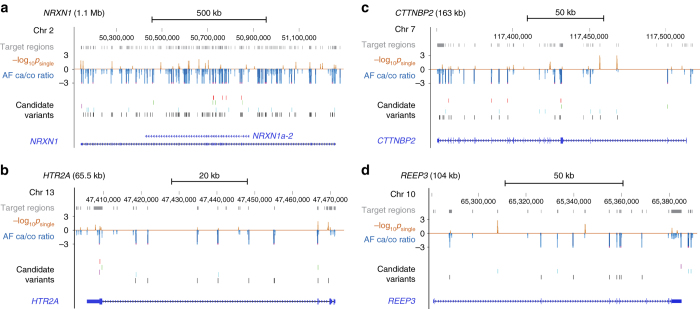
Fig. 2.
Targeted-sequencing detects both coding and regulatory candidate variants in the four top-scoring genes a NRXN1 b HTR2A c CTTNBP2 and d REEP3. Sequenced “Target regions” are shown as gray boxes above the red “–log10 p single” track displaying the association p-values for all detected variants and the blue “AF ca/co ratio” track showing the ratio of OCD AF over control AF. “Candidate variants” are annotated as missense (red), synonymous (green), untranslated (purple), DHS variants (blue), or unannotated (black). Lastly, the gene is shown as a horizontal blue line with exons (solid boxes) and arrows indicating direction of transcription. The highest scoring isoform of NRXN1, NRXN1a-2, is shown in (a)

