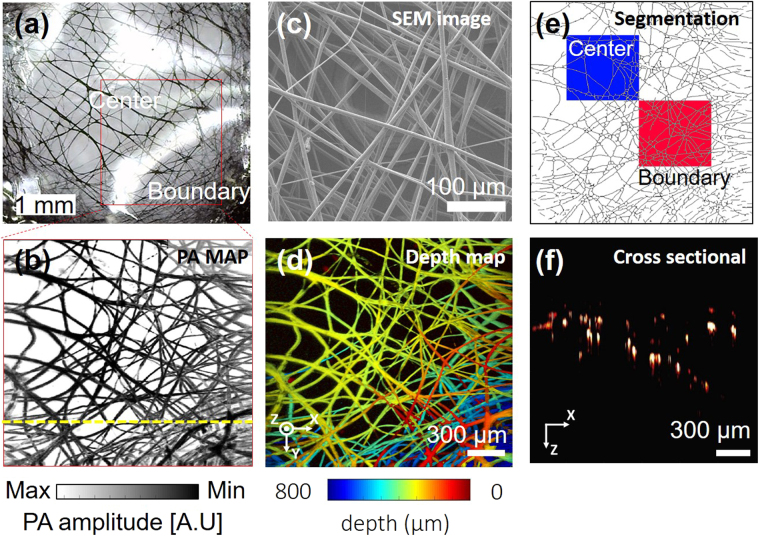
Figure 5.
PA image of electrospun microfibers. (a) Photograph of electrospun microfibers dyed with black ink. (b) SEM image of electrospun microfibers. (c) PA MAP image of electrospun microfibers. (d) Depth map image corresponding to (c); pseudo color encodes depth information. (e) Computed-thinned image of electrospun microfibers. Blue box indicates a sampling area in the center region; red box indicates a sampling area near the boundary region. (f) Cross-sectional B-scan image of electrospun microfibers along the yellow dotted line in (b). SEM, scanning electron microscopy and MAP, maximum amplitude projection.

