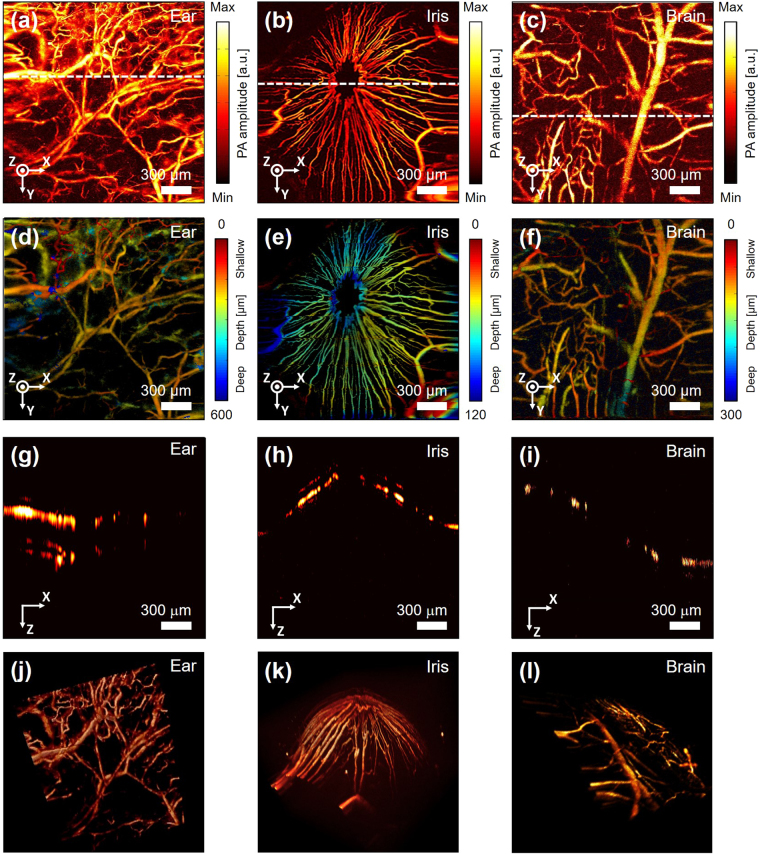
Figure 6.
In vivo PA images of microvasculature in a mouse ear, iris, and brain (a), (b), (c) PA MAP images of microvasculature in a mouse ear, iris, and brain. (d), (e), (f) Depth map image of top views of microvasculature in the mouse ear and brain, and a frontal view of the microvasculature in a mouse iris. Pseudo color indicates depth information. (g), (h), (i) B-scan cross sectional images of the mouse ear, iris, and brain along the white dashed lines in (d), (e), and (f). (j), (k), (l) 3D PA volumetric images of a mouse ear (Supplementary Video S2), iris, and brain.

