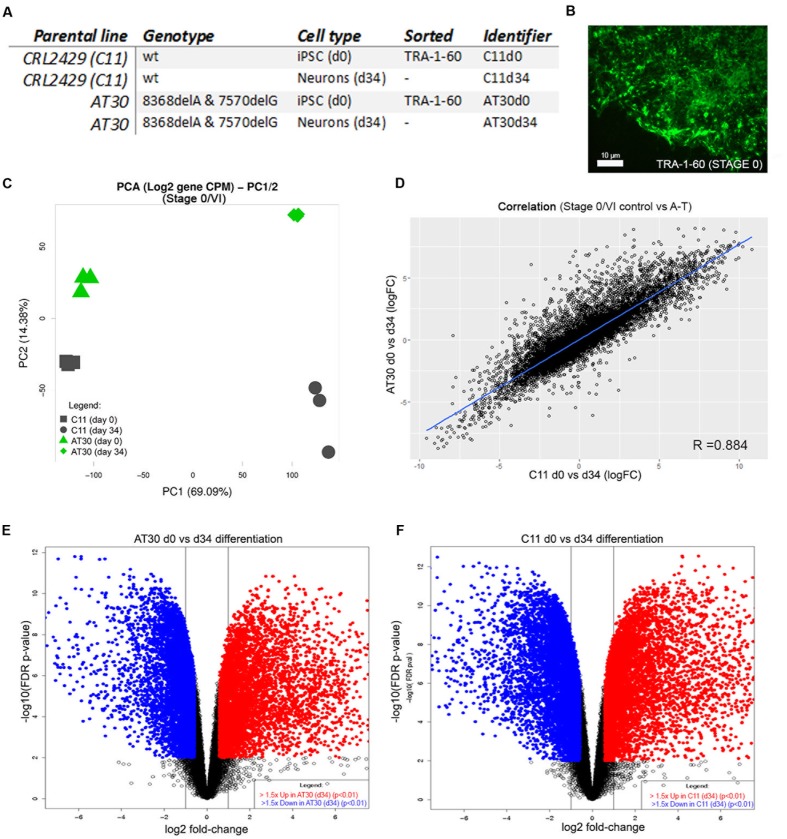
FIGURE 3.
Transcriptomic characterization of differentiated neurons. (A) Table detailing iPSCs selected for RNA sequencing. (B) Representative iPSC colony immunolabelled with antibody to TRA-1-60. Scale bar is 10 μm. (C) PCA shows tight clustering of experimental replicates. Y-axis shows PC2, X-axis shows PC1. (D) Correlation between samples following differentiation by limma-estimated log-fold change in expression between AT30 d0 vs. d34 and C11 d0 vs. d34. (E,F) Volcano plots show changes in the expression of genes after differentiation (E = AT30 d0 vs. d34, F = C11 d0 vs. d34). Differentially expressed genes (adj. p-value < 0.01 and logFC > 1.5) are shown as blue/red points.

