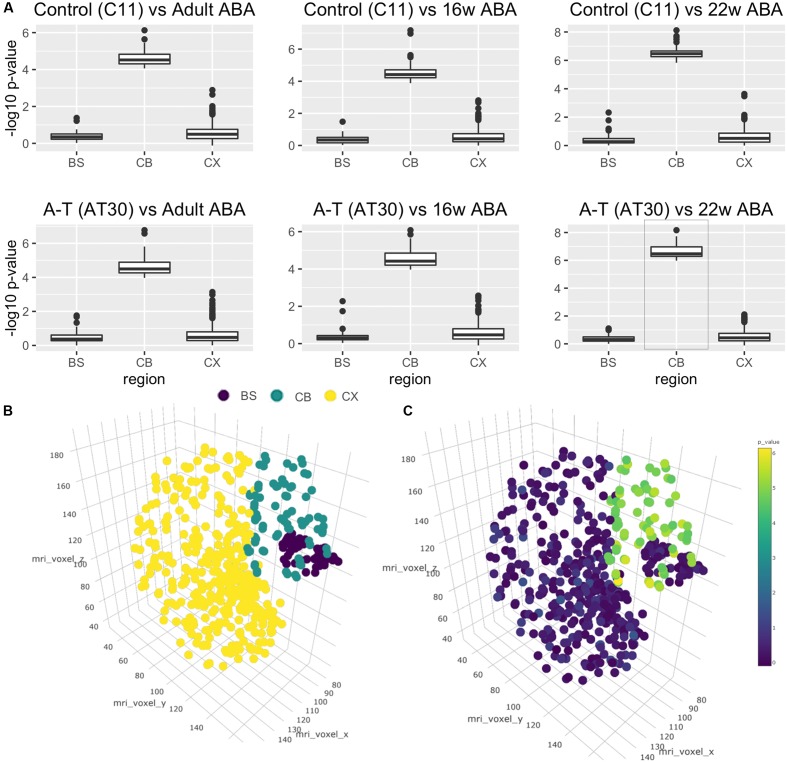
FIGURE 4.
Cross-study analysis using transcriptional data from the Allen Brain Atlas. (A) Wilcoxon’s rank-sum tests shows transcriptional similarity between brain regions and C11 (top)/AT30 (lower) cerebellar neurons. (B) Three-dimensional reconstruction of Allen Brain Atlas data demonstrating discrete regions (BS, brain stem; purple/CB, cerebellum; teal/CX, cortex; yellow). (C) Three-dimensional reconstruction of Allen Brain Atlas samples showing -log10 p-values pertaining to comparison of differentiated cells to Allen Brain Atlas data from that region.

