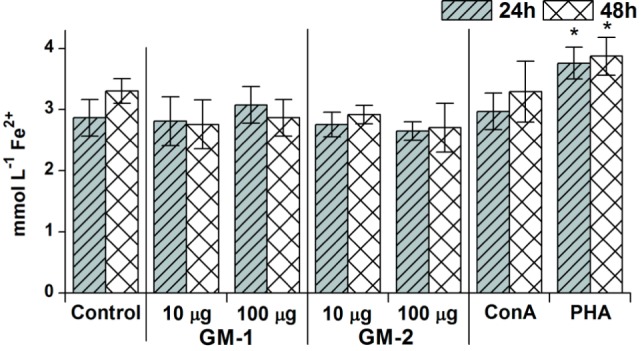
Figure 4.

Concentration- and time-dependent pattern of free radicals’ release. The release after 24 or 48 h stimulation of RAW264.7 macrophages in response to stimulation with 10 or 100 µg/mL concentration of glycoconjugates GM-1 or GM-2 and to concanavalin A (Con A, 10 µg/mL) and phytohemagglutinin (PHA, 10 µg/mL) as a positive controls; control represents untreated cells (Control). All data are presented as mean ± SD. Tests were carried out in triplicate. The statistical significance of differences between stimulated cells and untreated cells using one-way ANOVA and post hoc Bonferroni’s tests is expressed: *—0.01 < P < 0.05.
