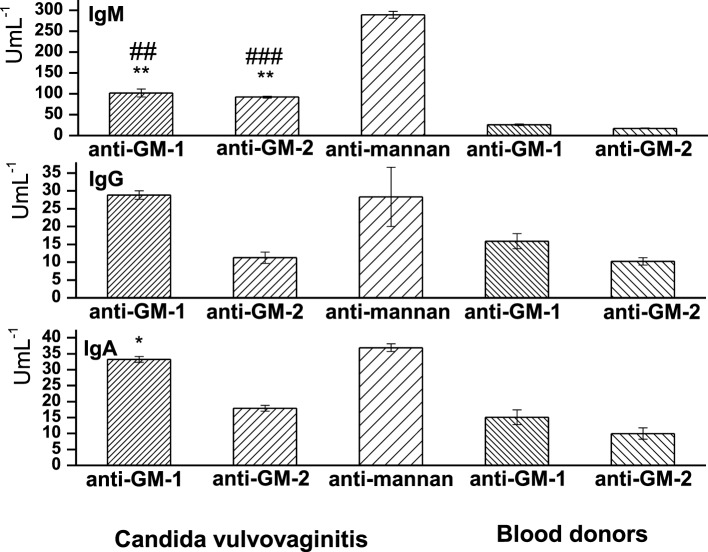
Figure 6.
Distribution of sera levels of anti-GM-1, anti-GM-2, and anti-mannan isotype class antibodies in vulvovaginitis patients and healthy controls (blood donors). Data are presented as mean ± SD. Analyses were carried out in triplicate. The statistical significance of differences between controls (blood donors) and vulvovaginitis patients using one-way ANOVA and post hoc Bonferroni’s tests is expressed as: **—0.001 < P < 0.01, *—0.01 < P < 0.05. The statistical significance of differences between anti-mannan Abs and anti-GM-1 and anti-GM-2 Abs using one-way ANOVA and post hoc Bonferroni’s tests is expressed as follows: ###—P < 0.001, ##—0.001 < P < 0.01.

