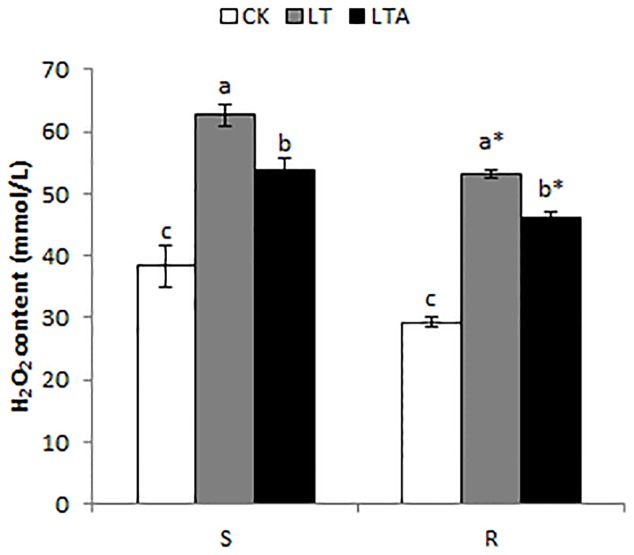
FIGURE 3.
Alterations of H2O2 content in the leaves of Bermudagrass after 7 days of different treatment. There were three repeats of each treatment. The CK represents control treatment at the optimum temperature (28/24°C, day/night). LT refers to cold treatment at a temperature of 4°C (day/night). LTA represents the treatment that treated with 100 μM ABA solution at a temperature of 4°C (day/night). S and R represented cold-sensitive and cold-resistance Bermudagrass genotype, respectively. Mean and SD were calculated from three repeats of each treatment. Columns marked with different letters indicate significant differences among different regimes at different genotype based on Ducan’s multiple range tests (P < 0.05). Columns marked with star represent statistical significance between R and S for a given regime based on Independent-samples t test (P < 0.05).

