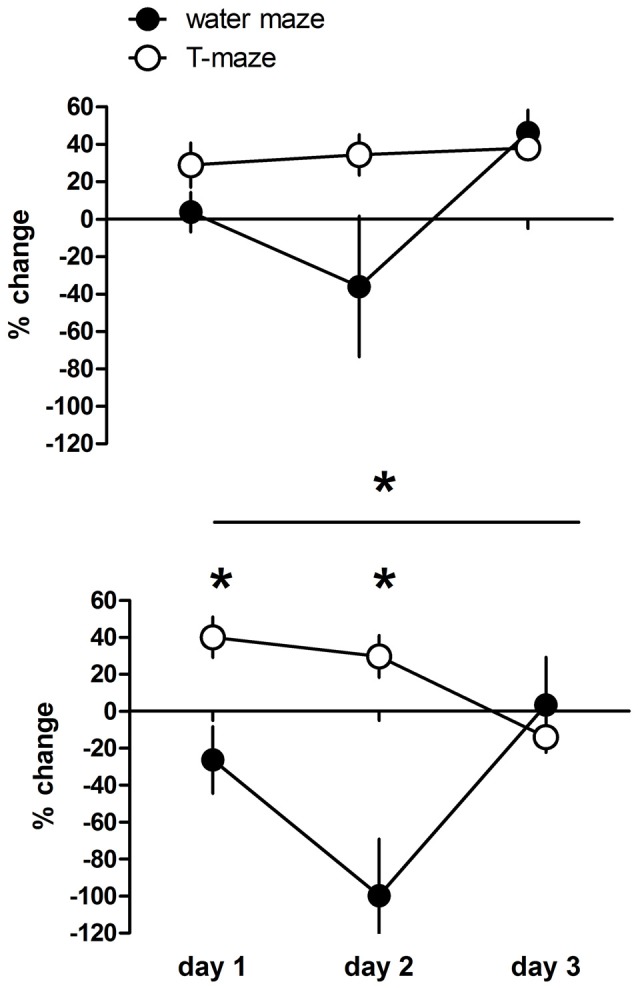
Figure 3.

Changes in working memory indices (T-maze) and escape latencies (water maze) expressed as variation in percentage from the mean value (100%) of the respective control group of individual D1R-like agonist treated rats at a dose of 1 μg or 5 μg. Positive values indicate improvement and negative deterioration of working memory. Significant differences between groups over the entire training are indicated by an asterisk above horizontal bars. Significant differences between groups for specific days are indicated by asterisks above daily data points. Given are the mean values and SEM.
