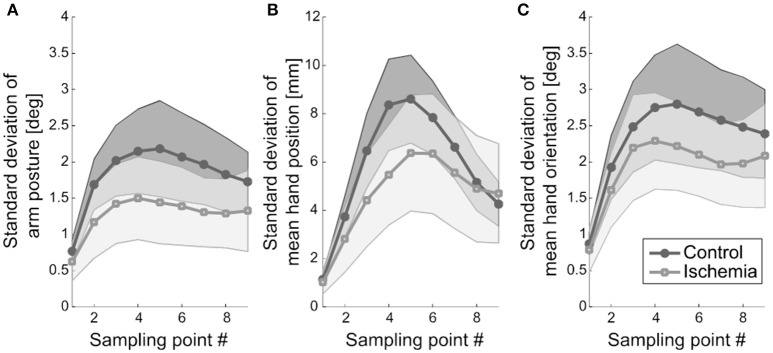
Figure 4.
Movement variability. (A) Standard deviation of arm posture, representing the mean across participants, is shown. Shaded areas represent the respective confidence intervals. (B) Standard deviation of mean hand position (+ confidence interval) is depicted. Hand position variability was less modulated under ischemia. (C) Standard deviation of mean hand orientation and the respective confidence interval is shown.

