Figure 5.
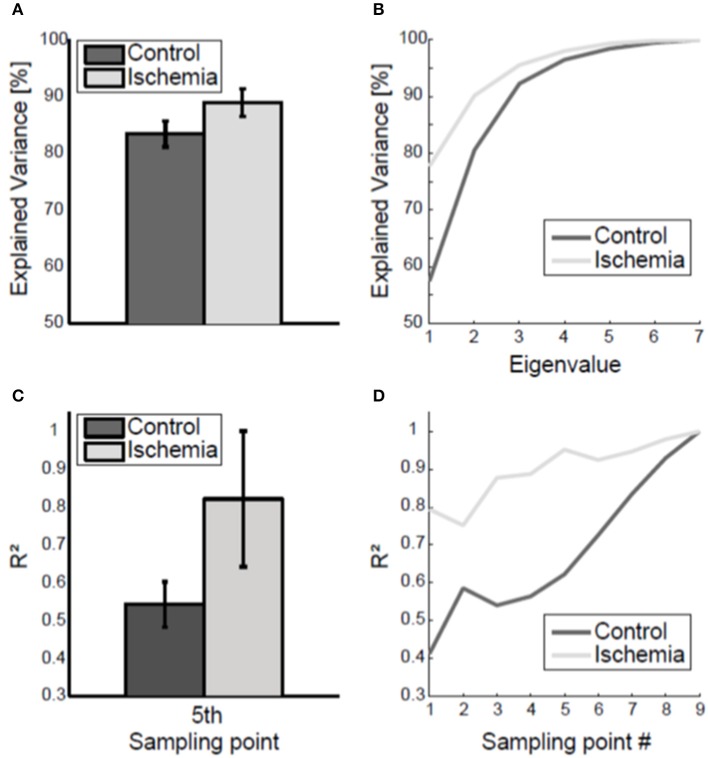
Coupling of joint angle variability. (A) Group mean (± standard deviation) of the variance explained by the two biggest eigenvalues, averaged across the nine sampling points, is shown. Under ischemia significantly more variance was explained by the first two eigenvalues as compared to the control condition. (B) Explained variance by the seven eigenvalues, averaged across the nine sampling points, is shown for one representative participant. (C) The coefficient of determination (R2) of final arm posture variance with respect to arm posture variance at the fifth sampling point. Error bars represent standard deviations. Under ischemia the coefficient of determination was higher than in the control condition. (D) The coefficient of determination (R2) of final arm posture variance with respect to arm posture variance for each sampling point is shown for a representative participant for both conditions.

