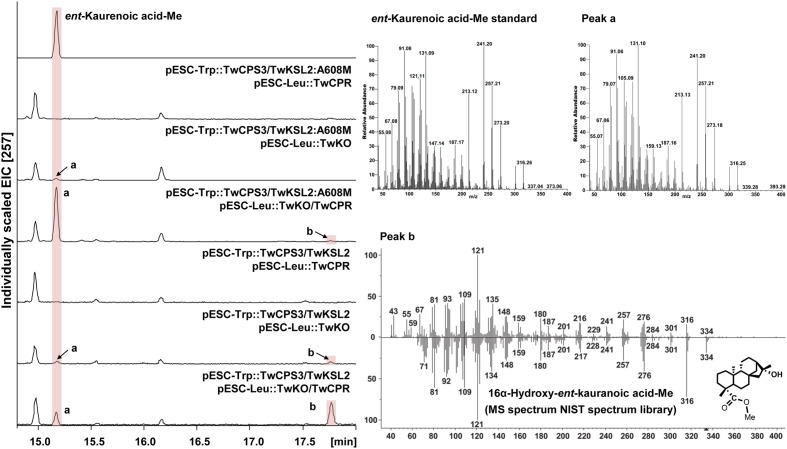
FIGURE 4.
GC–MS analysis of in vivo assay for TwKO activity. Peak a and b, methyl ester derivatives of the products from yeast strain BY-T20 cultures expressing TwKO combined with TwCPR, TwCPS3, and TwKSL2 (or TwKSL2:A608M), and their corresponding mass spectrums (Peak a, Rt = 15.17 min; Peak b, Rt = 17.77 min). Mass spectrum of peak a was identical to that of the authentic standard, and peak b was identified by comparison with the NIST spectrum library.

