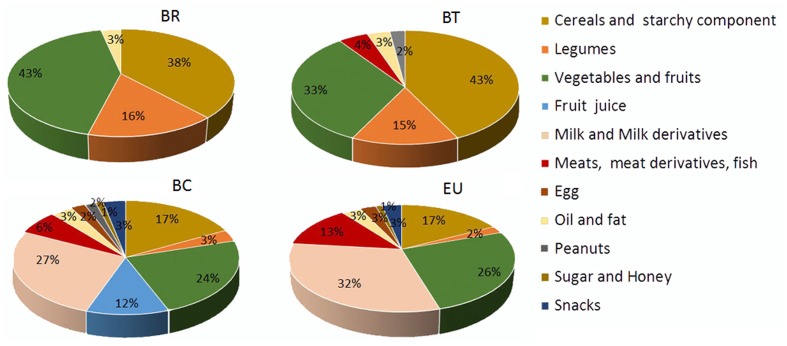
FIGURE 2.
Variety of food consumption in the four children populations. Pie charts indicate the percentages of daily foods assumed by the African and European populations. BR: children form rural village; BT: children from Nanoro town; BC: children from capital city of Burkina Faso; EU: children from Europe (Florence, Italy).

