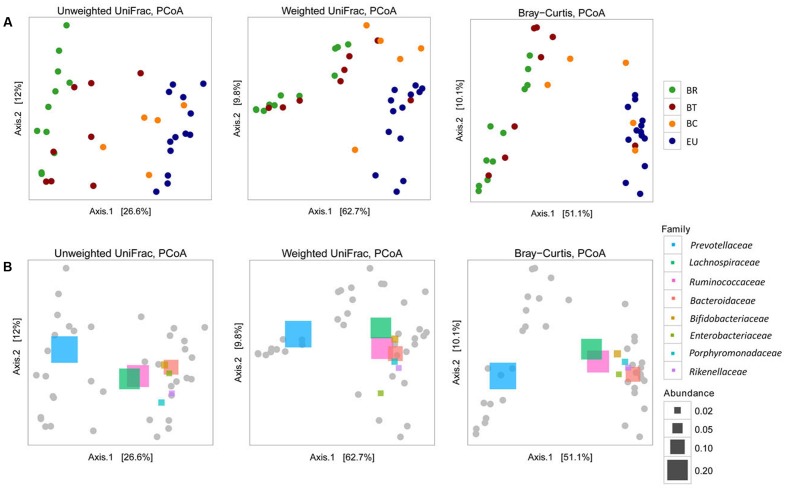
FIGURE 5.
Beta diversity (A) Principal coordinates analysis (PCoA) derived from unweighted and weighted UniFrac and Bray–Curtis distances among samples of the four populations (p = 0.0001 by PERMANOVA). Colored dots representative of the four populations are as in Figure 4. For each axis, in square brackets, the percent of variation explained was reported. (B) Beta diversity and correlation with the principal abundant bacterial families, represented by colored rectangles (p = 0.0001 by PERMANOVA). Different sizes of rectangles indicate the size of relative family abundance. For each axis, in square brackets, the percent of variation explained was reported.

