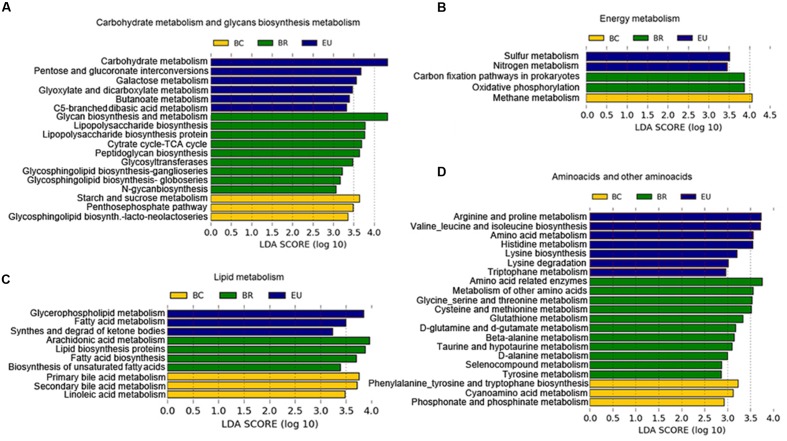
FIGURE 7.
Differences in the most representative bacterial functional classes (KEGG categories level 3). (A–D) Functional pathways significantly enriched in African and European populations based on PICRUSt prediction. LEfSe results indicate a sequentially significant ranking among populations (Alpha value = 0.05 for the factorial Kruskal–Wallis test among classes). The threshold for the logarithmic LDA score was 2.0.

