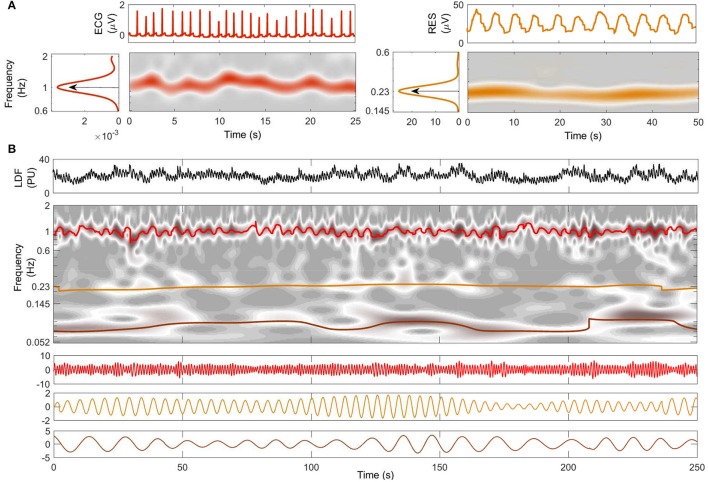
Figure 2.
Decomposition into oscillatory modes. (A) Typical time windows of the signals, their wavelet transforms, and their averaged power spectra. The central frequency of each oscillation is shown for ECG (red) and respiration (orange). (B) A 250-s window of the LDF signal from the same subject is shown in the top panel. The time-frequency evolutions of the modes extracted by NMD (second panel) are indicated by color with heart-rate red, respiration orange, and myogenic brown. The time evolutions of the extracted modes are plotted below, with the same color-code.

