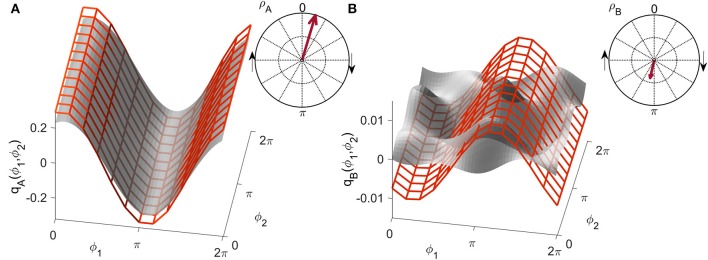
Figure 3.
Examples of the similarity index for (A) high and (B) low similarity. The form obtained numerically from a unidirectionally coupled system, shown with a red grid, is shifted along the coupling function obtained from measured data, shown in gray, to detect the highest similarity modulus . The arrow in the polar plot has a modulus equal to and a phase corresponding to the phase-shift of the red grid.

