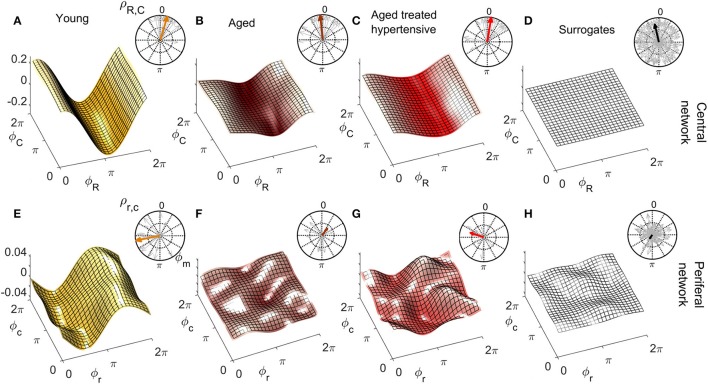
Figure 6.
Group-averaged coupling functions in the central network (top row) compared with equivalent results from the peripheral network (bottom row). In each case the color coding is: Y (gold), A (brown), ATH (red), and surrogates (gray). (A–C) Show the coupling functions between the phases of centrally measured respiratory ϕR and cardiac ϕC oscillations, and (E–G) Show the equivalent quantity between the phase of respiratory ϕr and cardiac ϕc oscillations in the peripheral network. (D,H) show the surrogate coupling functions computed to check the validity of the results presented in each row. The polar plot in the top-right corner of each figure indicates the similarity index ρ for the average form (colored arrow) and for the individual subjects (gray arrows). Note how, with aging, the forms lose amplitude in the central network and resemble the variability of surrogates in the peripheral network.

