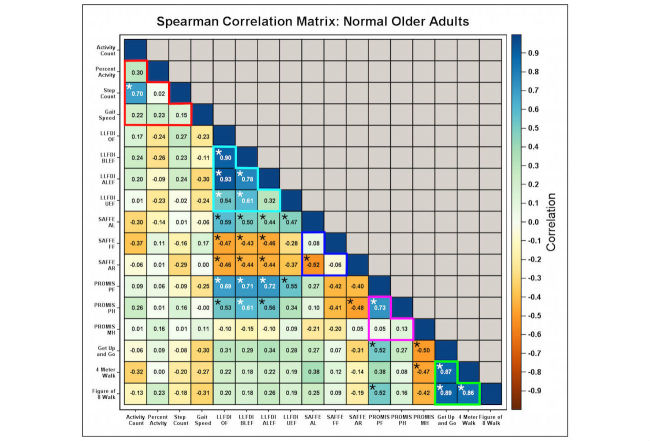
Figure 6.
Multiple significant correlations across different functional assessment metrics are present in functionally intact older adults. Confusion matrix depicting correlation structure (metrics across matrix bottom row) of mobile phone-based activity measures (activity count, percent activity, step count, gait speed), questionnaire-based measures of functional status (LLFDI, SAFFE, PROMIS), and performance battery based measures of functional status (Get Up and Go, 4 meter walk, F8W) for functionally intact participants. For each entry, correlation strength is depicted as the color within the box; interpretation color bar provided on the right. Numeric values within each box are individual correlations. Asterisks depict interactions with P values less than .01. Interactions grouped within the red lines depict correlations within mobile phone-derived activity measures; interactions grouped within cyan lines depict correlations within LLFDI measures; interactions grouped within blue lines depict correlations within SAFFE measures; interactions within grouped violet lines depict correlations within PROMIS measures; interactions grouped within green lines depict correlations within performance battery measures.

