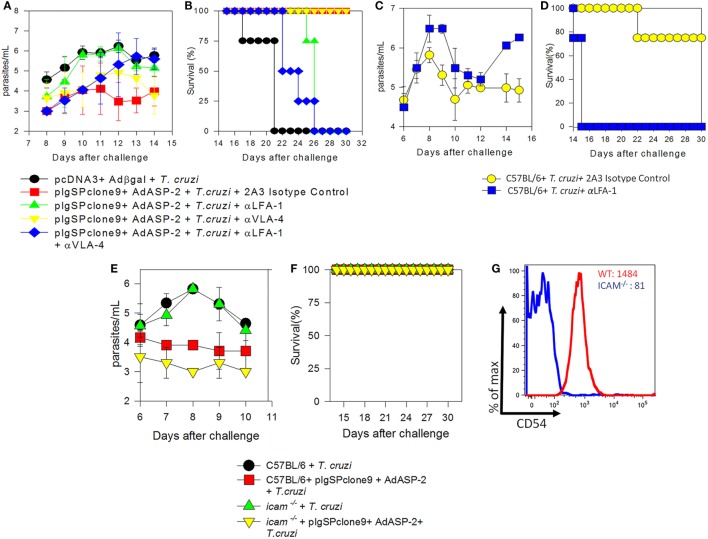
Figure 1.
LFA-1 blockade increases blood parasitemia and culminates in the death of A/Sn and C57BL/6 mice. A/Sn-, C57BL/6-, and intercellular adhesion molecule (ICAM)-deficient mice were immunized with plasmids pcDNA3 and/or pIgSPclone9 and adenoviral vectors Adβgal and AdASP-2. Fifteen days after the last immunization dose, mice were infected with 150 (A/Sn) and/or 104 (C57BL/6 and ICAM mice) blood trypomastigotes of the Y strain of Trypanosoma cruzi. Anti-VLA-4 and/or LFA-1 treatment was performed every 48 h after infection until the 20th days after infection. (A) Blood parasitemia was assessed, and values were log transformed and parasitemia data for each mice group are represented as mean ± SD for each group (n = 4). Values from peak parasitemia (day 12) were compared by one-way ANOVA and Tukey’s HSD tests, and the results were as follows: Significant differences were found between the red in green groups (P < 0.05). There were no significant differences between the blue group and the green group (P > 0.05). (B) Kaplan–Meier curves for survival of the different groups were compared using the log-rank test. The results of the comparisons were as follows: The mice in red group survived longer than the mice in green group. The survival rate of mice in the blue group was similar to the mice in the green group. (C) Log parasitemia data for each mice group (C57BL/6 mice infected and/or treated with anti-LFA-1) are represented as mean ± SD for each group (n = 4). Values from peak parasitemia (day 9) were no significantly different across the groups (P > 0.05). On day 14, significant difference was found between the infected and treated with anti-LFA-1 mice and infected and treated with the anti-2A3 isotype control mice (P < 0.05). (D) Kaplan–Meier curves for survival of the different groups were compared using the log-rank test. The results of the comparisons were as follows: the mice in yellow group survived longer than the mice in blue group. (E) Log parasitemia data for each mice group (ICAM-deficient and C57BL/6 mice) are represented as mean ± SD for each group (n = 4). Peak parasitemia values (day 9) were significantly different across C57BL/6 groups and in ICAM-deficient mice groups (P > 0.05). (F) Kaplan–Meier curves for survival of the different groups were compared, and there were no differences across groups. (G) MFI of CD54 (ICAM-1) on CD8+ T cells from C57BL/6 and ICAM-deficient mice: the red line indicates MFI of naïve C57BL/6 mice, whereas the blue line indicates MFI of naïve ICAM-deficient mice. One out of two individual experiments is shown.

