Figure 2.

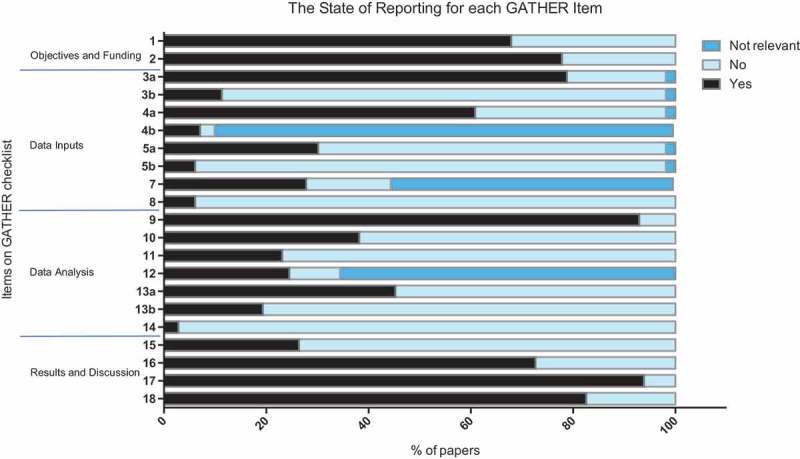
Stacked bar chart showing the percentage of studies that either correctly reported a GATHER item (reported), failed to report a GATHER item (not reported), or had methods that rendered a particular item irrelevant (not relevant). n = 212.

Stacked bar chart showing the percentage of studies that either correctly reported a GATHER item (reported), failed to report a GATHER item (not reported), or had methods that rendered a particular item irrelevant (not relevant). n = 212.