Figure 3.

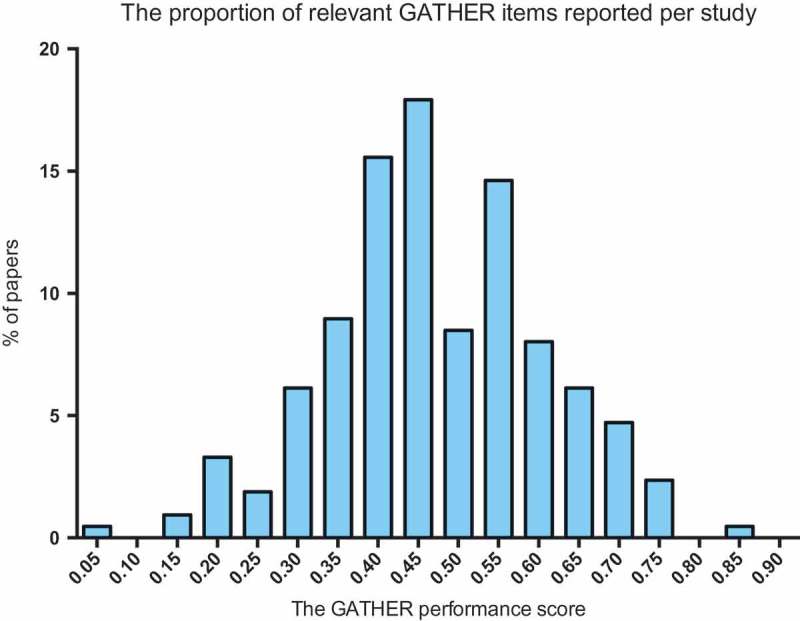
Bar chart depicting the distribution of the GATHER performance score across all papers, where the GATHER score is the proportion of relevant items being reported by a given study. n = 212.

Bar chart depicting the distribution of the GATHER performance score across all papers, where the GATHER score is the proportion of relevant items being reported by a given study. n = 212.