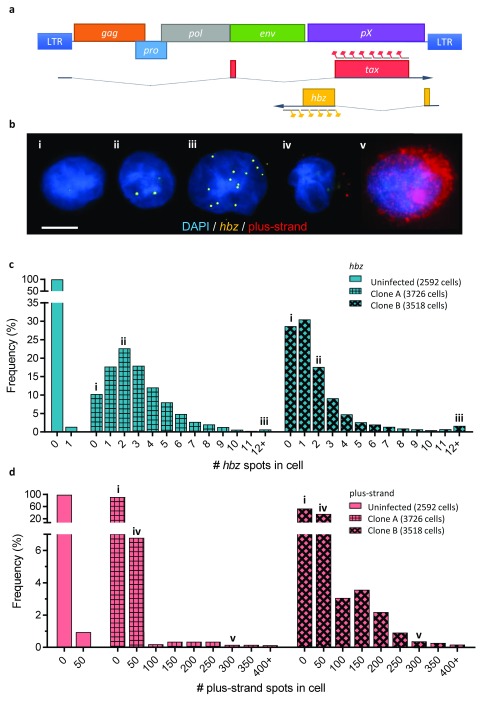
Figure 1. Single-molecule RNA-FISH reveals heterogeneity of plus-strand and hbz expression within and between clonal cell populations.
a. Schematic of the HTLV-1 genome, showing the spliced transcripts of the plus-strand and hbz; the sequences targeted by probes on the plus-strand and the minus are marked by red and yellow flags respectively. b. Composite fluorescent micrograph with representative examples of cells expressing different levels of hbz: i) silent, ii) low (<5 spots) and iii) high (≥5 spots); and plus-strand RNA: iv) low (<100 spots), v) high (≥100 spots). The Roman numerals show the respective cells’ positions in panels c and d. Scale bar is 5 µm. c. Frequency distribution of hbz expression (number of hbz spots/cell) in individual cells, from one uninfected and two HTLV-1-infected clones. d. Frequency distribution of plus-strand expression in individual cells (same clones as in c); bins show the number of cells with 0-1 plus-strand spots (“0”), 2-50 spots (“50”), 51-100 spots (“100”), 101-150 spots (“150”) etc.

